


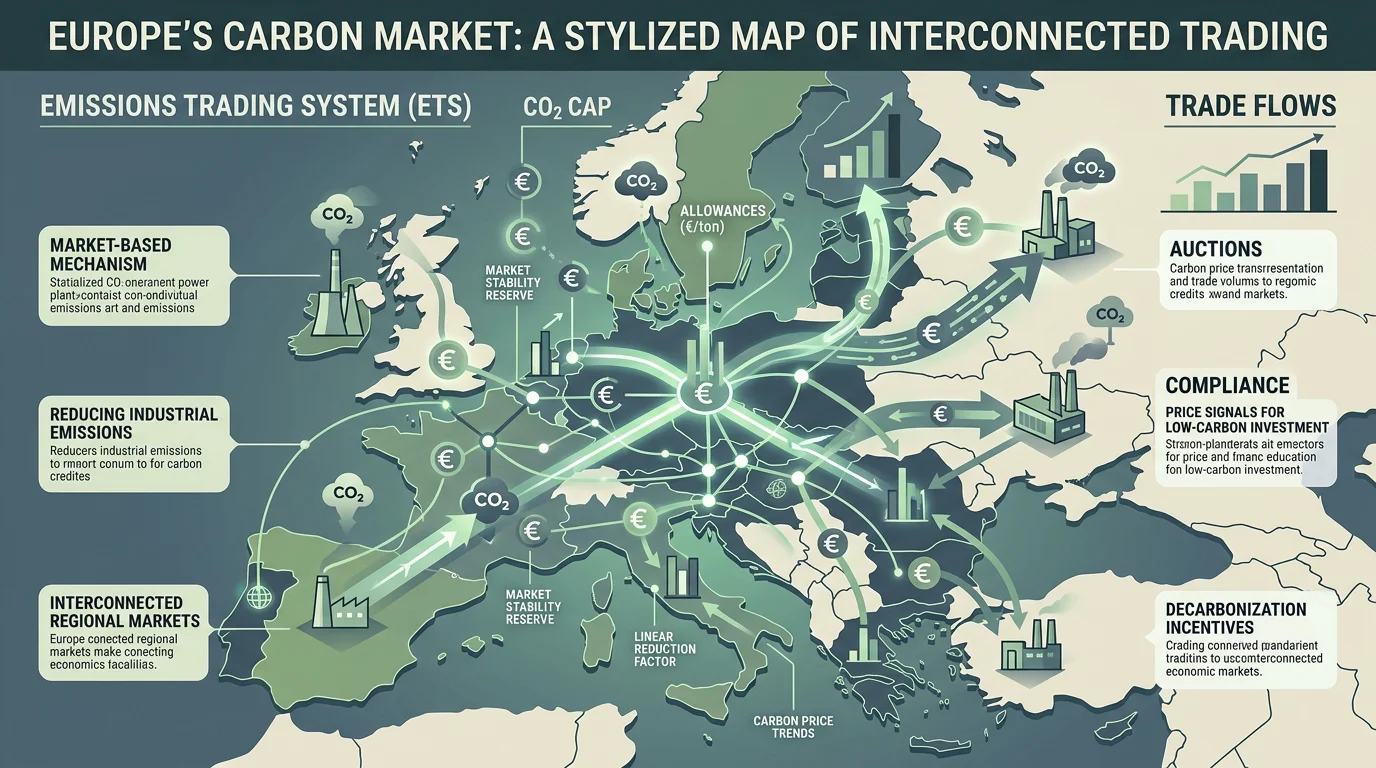

Carbon has quietly become one of Europe's most consequential financial instruments. European Union Allowances now sit alongside conventional commodities on major exchanges, traded by banks, funds, and industrial operators alike. For a grounded view of prices and turnover, our carbon market data overview tracks how the system has scaled from a compliance tool into a deep, liquid marketplace.
Understanding the scale of the EU ETS as a financial market means looking past emissions figures toward money flows, participants, and instruments. The EU ETS is the oldest cap-and-trade system in force and the largest in terms of trading volume and value, a position that continues to attract financial capital in 2026.
How large is the EU ETS in value and price terms today?
Ask exactly how big is the eu ets as a financial market, and the clearest answer starts with revenue and price. By the end of 2025, the EU ETS had raised a cumulative total of EUR 265.7 billion (USD 297.1 billion) since its inception, funds that member states are now obliged to direct toward climate action and energy transformation.
Price levels reinforce the point. In 2025, the average auction clearing price stood at EUR 73.43, while the average secondary market price reached EUR 74.35. In 2026, allowances have continued to trade in a similar band, with EU carbon permits quoted near 73.64 euros in late March 2026. The all-time high of 105.73 euros, reached in February 2023, underlines how much value now changes hands per tonne.
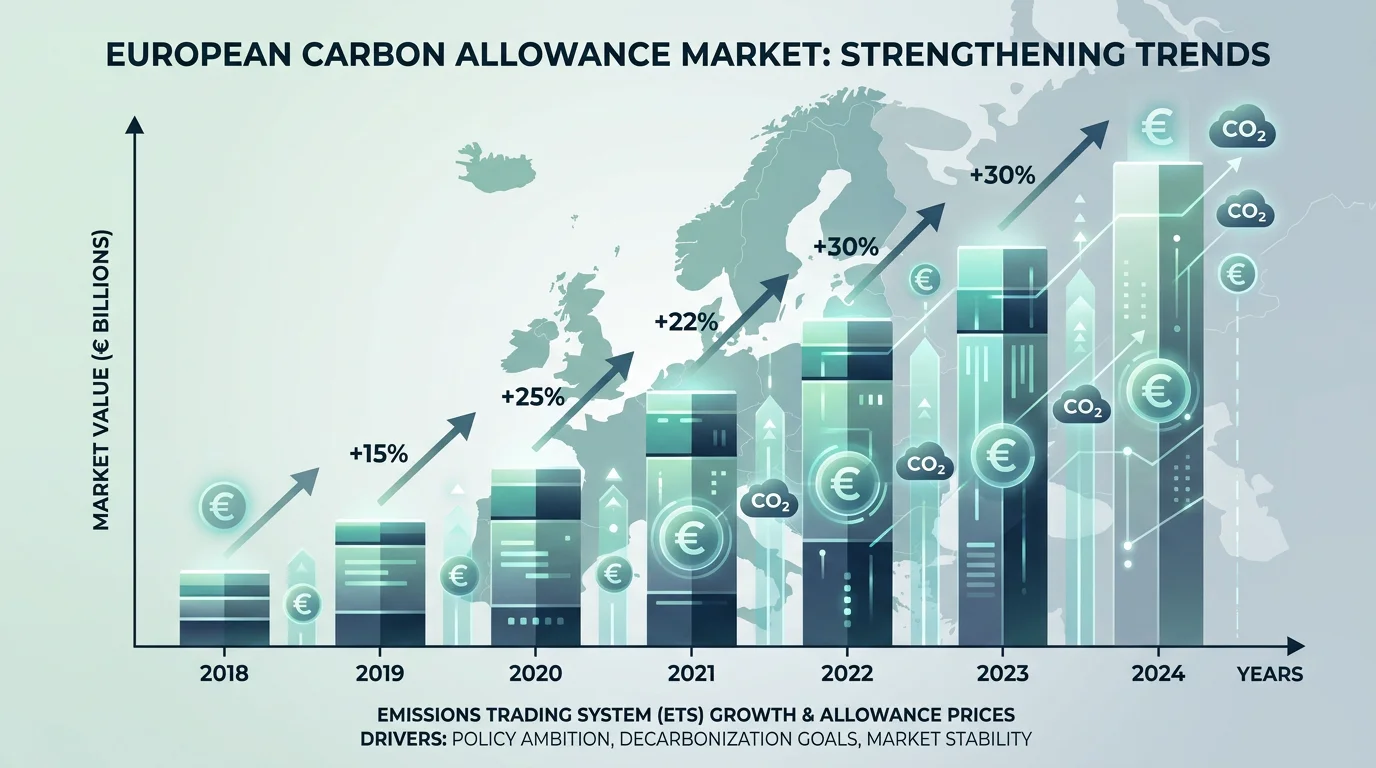
These figures matter because EUA prices feed directly into power costs, industrial planning, and hedging strategies across the continent. When you evaluate the market's importance, the sustained price level, rather than any single peak, signals durable financial depth.
Who actually trades in the EU carbon market?
The composition of participants explains why the EU ETS behaves like a mature financial market rather than a simple compliance registry. Since EUAs were classified as financial instruments under MiFID II in 2018, banks, investment firms, and funds have joined industrial operators at the trading table.
Their footprint is substantial. According to the ESMA carbon markets report, investment firms and credit institutions accounted for 62% of overall trading volumes. On the derivatives side, the same report recorded an average of 917 daily position holders, of which 425 were investment funds. This blend of compliance buyers and financial intermediaries is precisely what deepens liquidity and sharpens price discovery.
If you need to understand what sustains that depth on a daily basis, our guide to EU ETS liquidity breaks down the drivers behind trading activity and where volumes concentrate.
Spot versus derivatives: where the volume sits
A common misconception is that carbon trading happens mainly on the spot market. In reality, derivatives dominate. The ESMA analysis found that trading in futures accounted for almost three fourths of on-exchange trading, followed by options, with call options largely purchased by financial participants.
This structure is not incidental. Futures and options let compliance entities lock in prices in advance and reduce cost uncertainty, while giving financial players room to express directional and hedging views. The result is a layered marketplace where physical settlement is only one part of a much larger financial architecture.
The interplay between allowance prices and power markets adds another dimension. For readers focused on that connection and the reform outlook, our EU ETS and energy markets analysis explains how carbon costs transmit into electricity and fuel prices.
The scale of coverage behind the market
Financial size rests on a broad regulatory base. The data reported under the system now cover, according to the European Environment Agency, more than 16,000 stationary installations, 1,600 aircraft operators, and 2,600 maritime operators.
That coverage keeps expanding. Maritime transport entered the system in 2024, with surrender obligations phasing in through 2025 and 2026. Each new sector adds compliance demand, which in turn feeds trading volumes and the financial scale of the market. Coverage and financial depth reinforce one another.

How access differs across trading venues
Market size is only useful if you can participate efficiently. Traditional carbon exchanges have long structured access around large standard lots, which raises the barrier for smaller participants. The comparison below sets that model against how we designed our platform.
| Access criterion | Traditional carbon exchanges | Initiativ (our platform) |
|---|---|---|
| Minimum trade size | Typically a standard lot of 1,000 EUAs | From 1 EUA, equivalent to 1 tonne of CO₂ |
| Live pricing | Often limited transparency | Transparent real-time price monitoring |
| Automation | Varies by venue | API access for automated trading |
| Risk controls | Varies by venue | Pre-trade risk controls before execution |
| Custody | Varies by venue | Segregated cash account with clearing support |
Smaller trade sizes and transparent pricing lower the entry threshold for both corporates and financial participants, which is why we built the platform around a starting size of a single allowance rather than a thousand.
Why the market keeps growing
Several structural forces point toward further expansion. The definitive stage of the EU's Carbon Border Adjustment Mechanism began in 2026, and its introduction has drawn additional participants into EUA trading. Meanwhile, the system remains linked with the Swiss ETS, and in May 2025 the EU and the UK announced their intention to link their respective systems.
Each of these developments widens the pool of participants and the volume of allowances in play. As carbon pricing spreads globally and markets interconnect, the financial scale of the EU carbon market is positioned to grow rather than plateau. That trajectory is what makes the EU ETS increasingly relevant to any portfolio touching European industry or energy.
The bottom line on EU ETS scale
The evidence is consistent: the EU ETS as a financial market is large, liquid, and maturing. With cumulative revenue above 265 billion euros, allowance prices in the low seventies, and financial institutions accounting for most trading volume, carbon now functions as a genuine asset class. If you operate in or around European industry, treat EUAs as you would any material commodity exposure. Monitor prices, understand the derivatives layer, and choose an access route that matches your trade size and automation needs.
Take action with Initiativ
Whether you manage compliance obligations or seek exposure to a growing asset class, participating in this market requires reliable execution, transparent pricing, and controls you can trust. We built our platform to remove the friction that has historically kept smaller participants and automated strategies out of the carbon market.
With our EU ETS trading platform for traders and corporates, you can trade EU Allowances in spot and derivative form from a single allowance, monitor live prices, set configurable alerts, and connect through our API. Simple onboarding, competitive fees, and pre-trade risk controls let you engage the market on professional terms. Request access to our demo environment to see it in action.
Frequently Asked Questions
What makes the EU ETS the largest carbon market?
It leads on both trading volume and value among cap-and-trade systems worldwide. Operational since 2005, it covers thousands of installations across power, industry, aviation, and maritime sectors. This scale, combined with financial-instrument status, gives it unmatched depth relative to other emissions markets.
How much revenue has the EU ETS generated?
By the end of 2025, the system had raised a cumulative total of roughly 265.7 billion euros since its inception. Member states are obliged to channel this revenue toward climate action and energy transformation. The figure continues to grow as auctioning proceeds each year.
Are EUAs considered financial instruments?
Yes. Since 2018, European Union Allowances have been classified as financial instruments under MiFID II. This reclassification brought banks, investment firms, and funds into the market alongside compliance entities, deepening liquidity and price discovery.
Do futures or spot contracts dominate EU ETS trading?
Derivatives dominate the market. Futures alone represent close to three quarters of on-exchange trading, followed by options. These instruments help compliance buyers hedge future costs and allow financial participants to manage risk and express market views.
How can smaller participants access the EU ETS?
Traditional exchanges often require large standard lots, which raises the barrier to entry. Through our EU ETS trading platform, you can trade from a single allowance with transparent live pricing and API automation. This makes participation practical for both corporates and financial firms of varying sizes.
This may interest you


Let’s connect
Do you want more information about what we do?