
In 2025, carbon pricing mobilized over $107 billion for public budgets worldwide, according to the World Bank's State and Trends of Carbon Pricing 2026 report. That figure alone signals a profound shift: governments and markets have turned carbon cap and trade from an academic concept into one of the most consequential economic mechanisms of the 21st century. For professionals navigating compliance obligations or seeking new trading opportunities, understanding how carbon cap and trade works is no longer optional. For a foundational overview of these mechanisms, our guide on emissions trading systems explained offers a thorough starting point.
Yet the mechanics behind cap and trade remain widely misunderstood. Many professionals conflate it with a carbon tax or confuse the primary market with the secondary market. This article breaks down each component of the system, from the setting of the emissions cap to the dynamics of allowance trading, the role of auctions, and the expanding global reach of these programs in 2026.
What Is Cap and Trade? Core Principles in Plain Terms
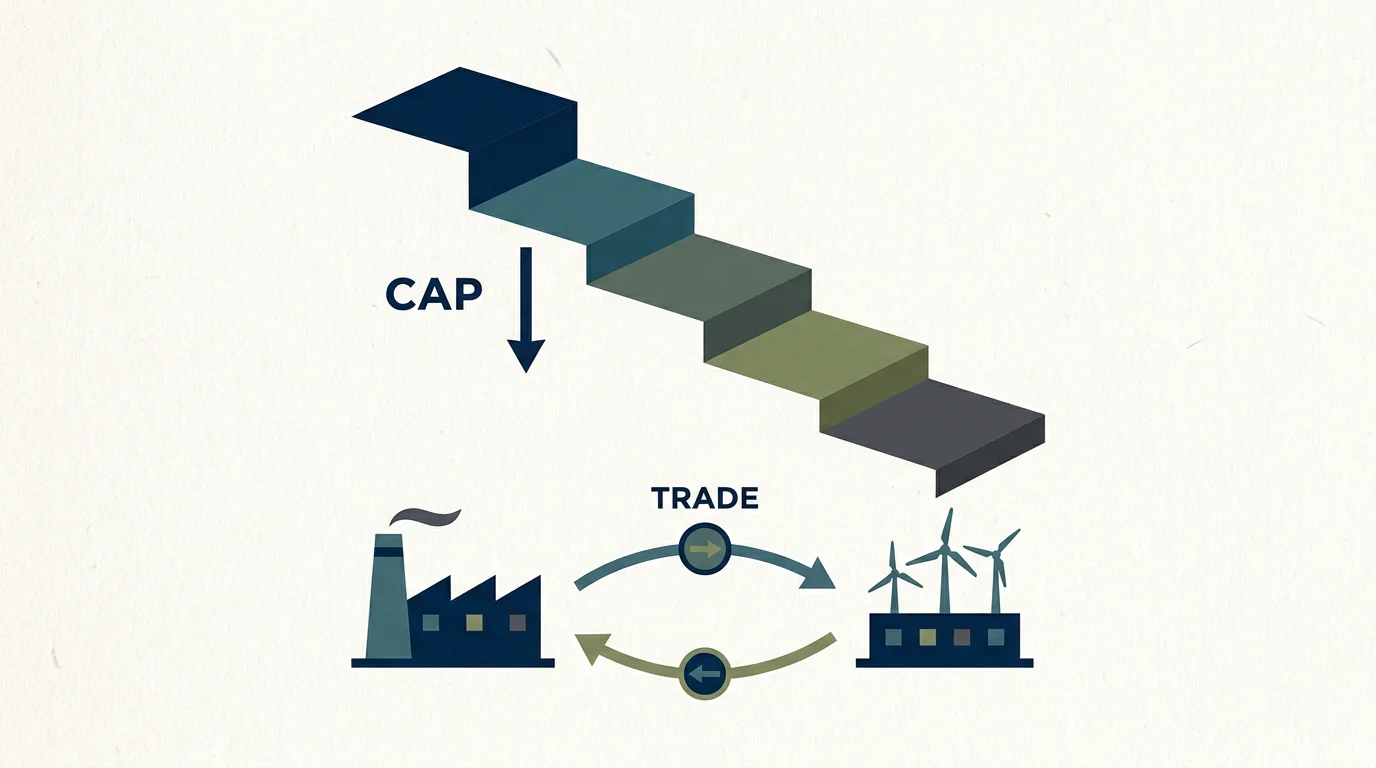
At its most fundamental level, a cap-and-trade system is a market-based approach to reducing greenhouse gas emissions. A government or regulatory body sets a firm limit, or "cap," on the total quantity of certain pollutants that may be emitted over a defined period. This cap is typically expressed in tonnes of carbon dioxide equivalent (CO₂e). The regulator then issues a corresponding number of emission allowances, each granting the holder the right to emit one tonne of CO₂e.
Companies covered by the system must hold enough allowances to match their actual emissions. Those that reduce their pollution below their allocated level may sell surplus allowances. Those that exceed it must purchase additional allowances from other market participants. This exchange, the "trade" component, establishes a market-driven carbon price that reflects the real cost of pollution.
The key distinction from a carbon tax is worth noting. A carbon tax fixes the price of emissions but leaves the total quantity of emissions uncertain. Cap and trade does the inverse: it fixes the quantity of emissions allowed (the cap) while letting the market determine the price. When a jurisdiction has a specific emissions reduction target, a cap-based system ensures that target is met regardless of price fluctuations.
How the Cap Is Set and Why It Declines
The emissions cap is the foundation of the entire system. Regulators establish it based on scientific evidence and climate policy objectives. In the European Union, for example, the cap is anchored to the goal of limiting global warming to well below 2 degrees Celsius above pre-industrial levels, in line with the Paris Agreement and the European Green Deal.
Crucially, the cap does not remain static. It is designed to decline each year, creating a progressively tighter constraint on total emissions. In the EU Emissions Trading System (EU ETS), the annual reduction factor was set at 1.74% per year through 2020, then increased to 2.2% per year from 2021 under Phase 4 reforms, and has been further steepened to meet the bloc's 2030 climate targets. This declining trajectory serves a dual purpose: it ensures cumulative emissions align with long-term climate goals, and it sends a credible, forward-looking signal to the market that allowance scarcity will increase over time.
The pace at which the cap falls directly influences the carbon price. A faster decline tightens supply, which, all else being equal, pushes prices upward and strengthens the incentive for companies to invest in decarbonization.
Primary Market: How Allowances Enter Circulation
There are two main channels through which emission allowances reach the market: free allocation and auctioning. Together, these form the primary market.
Free allocation is typically used for sectors at risk of "carbon leakage," where production could shift to jurisdictions without comparable carbon costs. Companies in these sectors receive a portion of their allowances at no charge, calculated using industry-specific benchmarks. However, free allocation is being phased down in many systems. The EU ETS, for example, is reducing freely distributed allowances for most industries and plans to phase them out almost entirely by 2030, particularly as the Carbon Border Adjustment Mechanism (CBAM) takes effect.
Auctioning is the other primary channel, and it is growing in importance. In the EU ETS, auctions are conducted daily through the European Energy Exchange (EEX). Eligible participants, including compliance entities, investment firms, and credit institutions, submit sealed bids specifying the volume and price at which they wish to purchase allowances. The clearing price is set at the point where demand equals the supply of allowances offered that day, and all successful bidders pay that uniform price.
Auction revenues represent a significant public finance mechanism. According to the ICAP Status Report 2026, ETS revenues reached a new record of nearly USD 80 billion in 2025. In the EU specifically, member states are now required to dedicate all auctioning revenues to climate- and energy-related purposes under directives adopted from 2023 onward.
Secondary Market: Where Price Discovery Happens
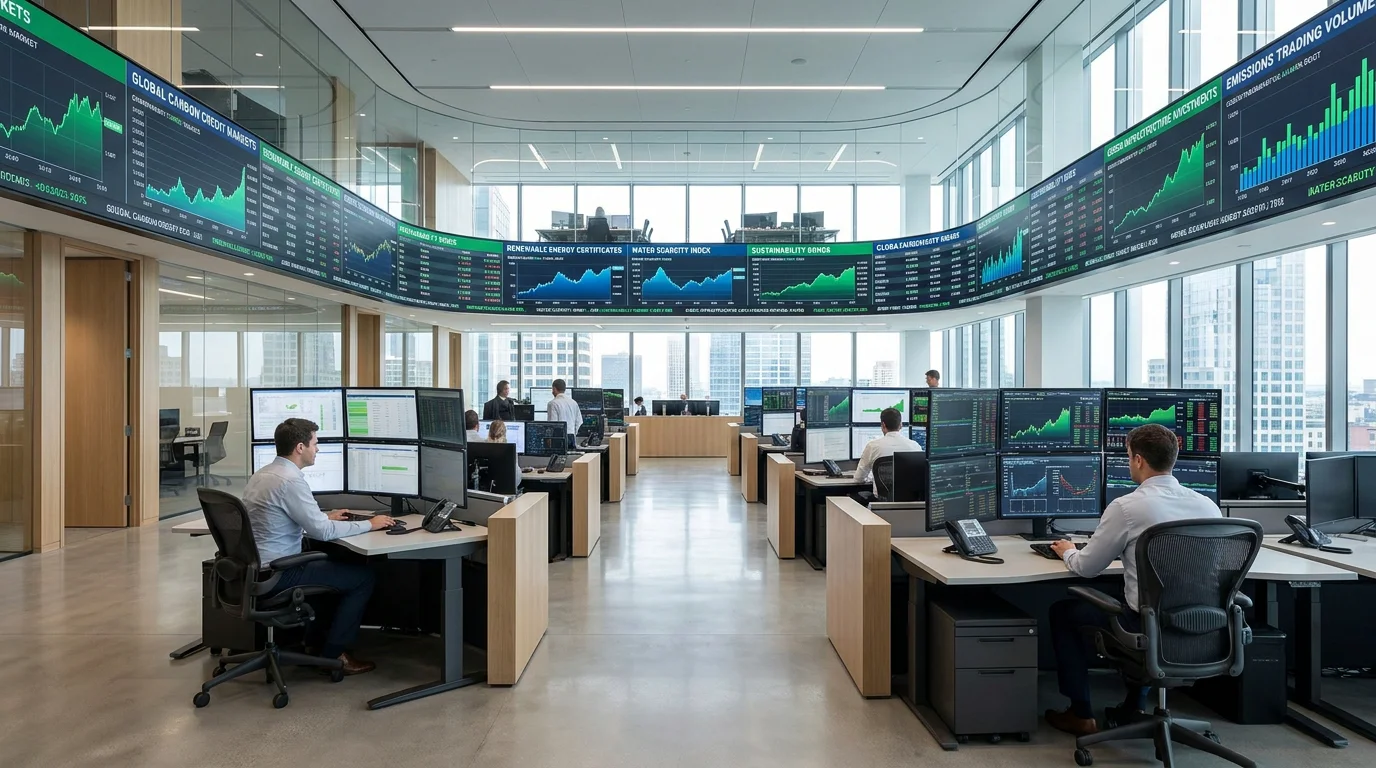
Once allowances have been issued or auctioned, they become tradable financial assets on the secondary market. This is where the true price discovery of carbon takes place. Participants buy and sell allowances at prices driven by supply and demand, independent of the initial auction or allocation price.
Since the implementation of MiFID II in 2018, EU Allowances (EUAs) have been classified as financial instruments. This regulatory change broadened the range of market participants well beyond compliance entities alone. Today, the secondary market includes banks, trading firms, asset managers, hedge funds, and carbon brokers, each bringing different objectives, time horizons, and risk profiles. This diversity has deepened market liquidity, reduced volatility, and improved price efficiency.
For organizations looking to participate in this market, whether for compliance, hedging, or financial reasons, having access to real-time pricing, transparent order books, and professional-grade execution tools is essential. Our carbon trading platform for corporates and traders is designed to meet precisely these needs, offering the ability to trade from as little as 1 EUA rather than the traditional 1,000 EUA minimum lot.
Understanding the distinction between the primary and secondary markets is critical for anyone engaging with EU carbon market allowances, as the dynamics of each market segment influence pricing behavior and trading strategy.
The Global Expansion of Cap-and-Trade Systems
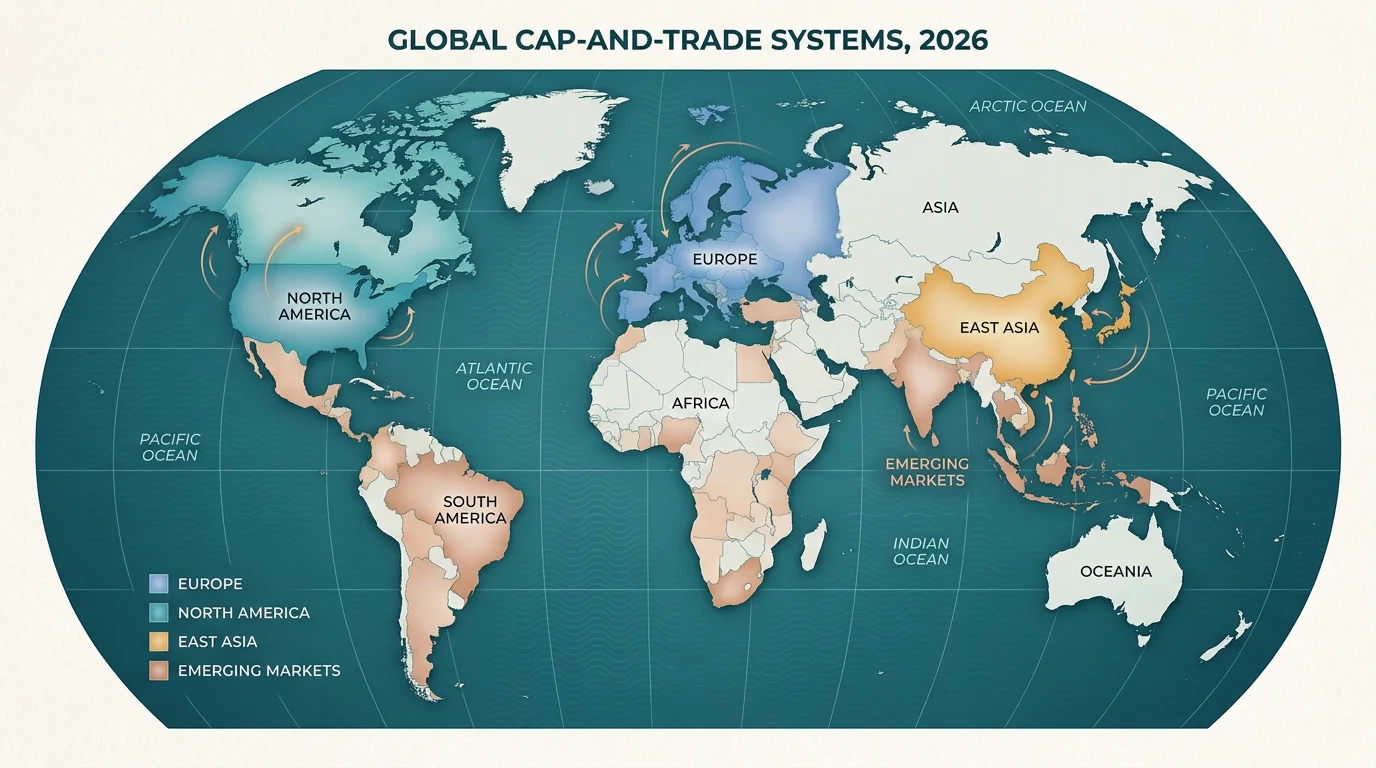
Forty-one emissions trading systems are now in force worldwide, covering 26% of global greenhouse gas emissions. This represents a remarkable expansion from just a handful of programs two decades ago. The ICAP report shows that the global emission coverage rate of national ETS expanded from 5% in 2005 to 23% in 2025, and the trajectory has continued upward into 2026.
Key milestones illustrate this growth. The EU ETS, launched in 2005, remains the world's largest system by market value. China has issued landmark guidelines to transition its national ETS to an absolute cap by 2027 and progressively expand coverage to all major industrial emitters. In the United States, California has been operating its cap-and-trade program since 2013, linked with Quebec since 2014, and has legislated its system through to 2045. Meanwhile, three new national-level systems are launching in 2026 in Japan, India, and Vietnam.
With an ETS in force in 14 of the G20 nations, emissions trading has moved decisively from a niche policy experiment to the center of global decarbonization strategy. The OECD's Effective Carbon Rates 2025 report confirms that free allowance shares are decreasing in many systems, and auctioning is taking on a greater role, signaling a broad trend toward more market-oriented carbon pricing.
The Economic Logic: Why Cap and Trade Drives Efficient Reductions
Why not simply mandate specific emission cuts for each company? The answer lies in economic efficiency. In any economy, the cost of reducing one tonne of CO₂ varies enormously from one firm to another. A power company might cut emissions cheaply by switching from coal to renewables, while a cement manufacturer might face far higher costs for comparable reductions.
Cap and trade harnesses this variation. Firms that can reduce emissions at low cost do so and sell their surplus allowances, earning revenue. Firms that face high abatement costs purchase allowances instead, paying less than the cost of immediate internal reductions. The result is that emissions fall to the level set by the cap, but the reductions happen where they are least expensive. This is the core efficiency gain of market-based carbon pricing.
Historical precedent reinforces this logic. In the 1990s, the United States used a cap-and-trade program to reduce sulfur dioxide emissions that caused acid rain. The program achieved its environmental target at a fraction of the projected cost, demonstrating that emissions trading could deliver pollution cuts more affordably than command-and-control regulation.
There is a nuance worth acknowledging. Carbon price volatility can create uncertainty for long-term investment planning. To address this, many modern systems incorporate market stability mechanisms, such as the EU's Market Stability Reserve, price floors in programs like RGGI and California, and banking provisions that allow firms to save surplus allowances for future use. Understanding the rules of the EU ETS is essential for participants navigating these stabilizing features.
Who Participates and Why It Matters
Participation in a cap-and-trade system is not limited to the industrial emitters who face compliance obligations. In today's carbon markets, participants fall into several categories:
- Compliance entities: Power plants, manufacturers, and other operators covered by the system. They must monitor emissions, hold sufficient allowances, and surrender them during each compliance period.
- Financial participants: Banks, trading firms, hedge funds, and asset managers who provide market liquidity, facilitate risk management through derivatives, and contribute to price discovery.
- Carbon brokers: Intermediaries who connect buyers and sellers, often serving smaller companies that lack direct market access.
The inclusion of financial participants has been transformative. Since the EU classified EUAs as financial instruments, market depth has improved significantly. The diversity of trading motivations, from compliance hedging to speculative positioning, creates a more stable and efficient marketplace. This is why the relationship between voluntary credits vs emissions trading continues to evolve as both compliance and voluntary approaches shape the broader carbon finance ecosystem.
Looking Ahead: Cap and Trade in a Changing Policy Landscape
The policy environment around emissions trading is shifting rapidly. The EU's CBAM has entered its compliance phase, and the UK is following suit, acting as a catalyst for broader carbon pricing ambitions in trading partner countries. The EU is also preparing to launch ETS 2 in 2028, which will extend emissions trading to cover buildings and road transport for the first time.
At the international level, carbon pricing now covers nearly 30% of global greenhouse gas emissions when both ETS programs and carbon taxes are counted together. All large middle-income economies have now either implemented or are planning direct carbon pricing instruments, according to the World Bank. This convergence suggests that carbon markets will only grow more interconnected and more material to corporate strategy in the years ahead.
For companies subject to the EU ETS and for financial professionals seeking exposure to carbon markets, the imperative is clear. Understanding how carbon cap and trade works provides the foundation. Acting on that understanding, through informed compliance management and strategic market participation, is what separates organizations that manage carbon risk from those that lead in the transition.
We built our exchange to make that participation more accessible, with transparent live pricing, competitive fees, and the ability to trade from a single allowance. Explore our programmable exchange for EUA trading and take the next step in your carbon market strategy.
Frequently Asked Questions
What is the difference between cap and trade and a carbon tax?
A cap-and-trade system fixes the total quantity of emissions allowed and lets the market determine the price of allowances. A carbon tax fixes the price of emissions but does not guarantee a specific reduction target. Cap and trade provides greater certainty on environmental outcomes, while a carbon tax offers greater price predictability for businesses.
How many cap-and-trade systems exist globally in 2026?
As of 2026, 41 emissions trading systems are in force worldwide, covering approximately 26% of global greenhouse gas emissions. New national programs in Japan, India, and Vietnam are among the latest additions, and more jurisdictions are actively developing their own systems.
Can smaller companies participate in carbon allowance trading?
Yes. While traditional carbon exchanges often require minimum lot sizes of 1,000 allowances, our exchange allows trading from as little as 1 EUA, equivalent to 1 tonne of CO₂. This lower barrier makes it possible for smaller compliance entities and financial participants to access the market directly, with real-time pricing and professional-grade execution tools.
This may interest you


Let’s connect
Do you want more information about what we do?