


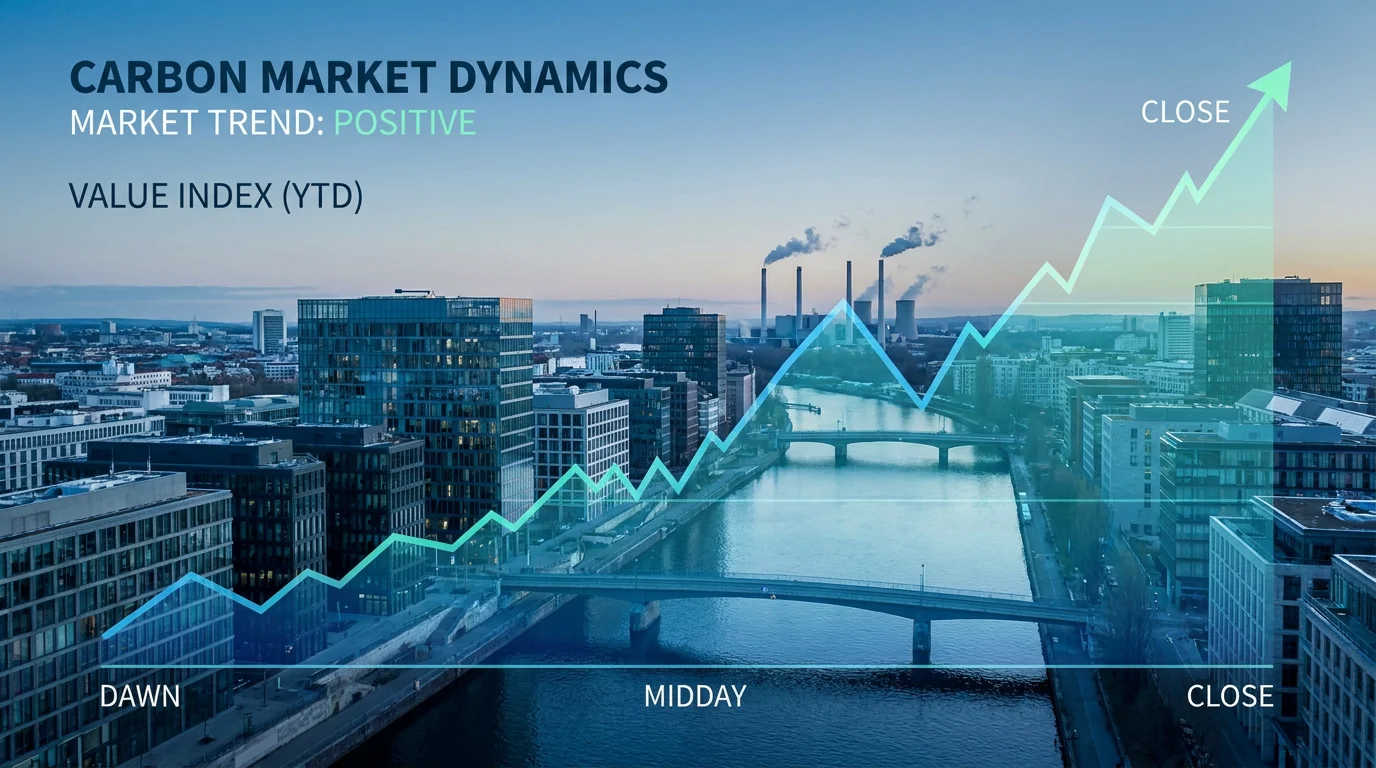

Carbon pricing in Europe has never carried more weight. On January 15–16, 2026, the price of EU Allowances hit €92 per tonne, a level not seen in more than two years. Since then, geopolitical turbulence and shifting fund positions have pulled prices back to the mid‑€70s, but the structural picture remains bullish. For compliance entities and financial participants alike, understanding the ETS trading price is no longer optional; it is a core input to procurement strategy, risk management, and long‑term capital planning.
This article breaks down where EUA prices stand today, the regulatory and market forces behind recent moves, analyst forecasts through 2030, and how market participants can position themselves. Whether you manage a compliance portfolio or trade carbon as a financial asset, the data below will ground your next decision in verified market intelligence.
Where Does the ETS Trading Price Stand Right Now?
EU Carbon Permits rose to €75.18 on May 8, 2026, up 0.07% from the previous day. Over the past month, the price has risen 1.98%, and it is up 6.80% compared to the same time last year. That year‑on‑year gain may look modest, but it masks significant volatility earlier in the year.
European carbon prices (December 2026 futures contract) exceeded €90 per tonne in January 2026, with ICE data showing €92 on January 15–16, marking a two‑year high. By January 20, EUA futures had dropped back to €84.9 per tonne amid pressure from sellers reacting to tariff threats from the United States. The swing illustrates how sensitive the carbon allowance price can be to geopolitical headlines, even though long‑term supply dynamics remain the dominant driver.
What Drives the Price of ETS Allowances?
The Declining Cap and Supply Squeeze
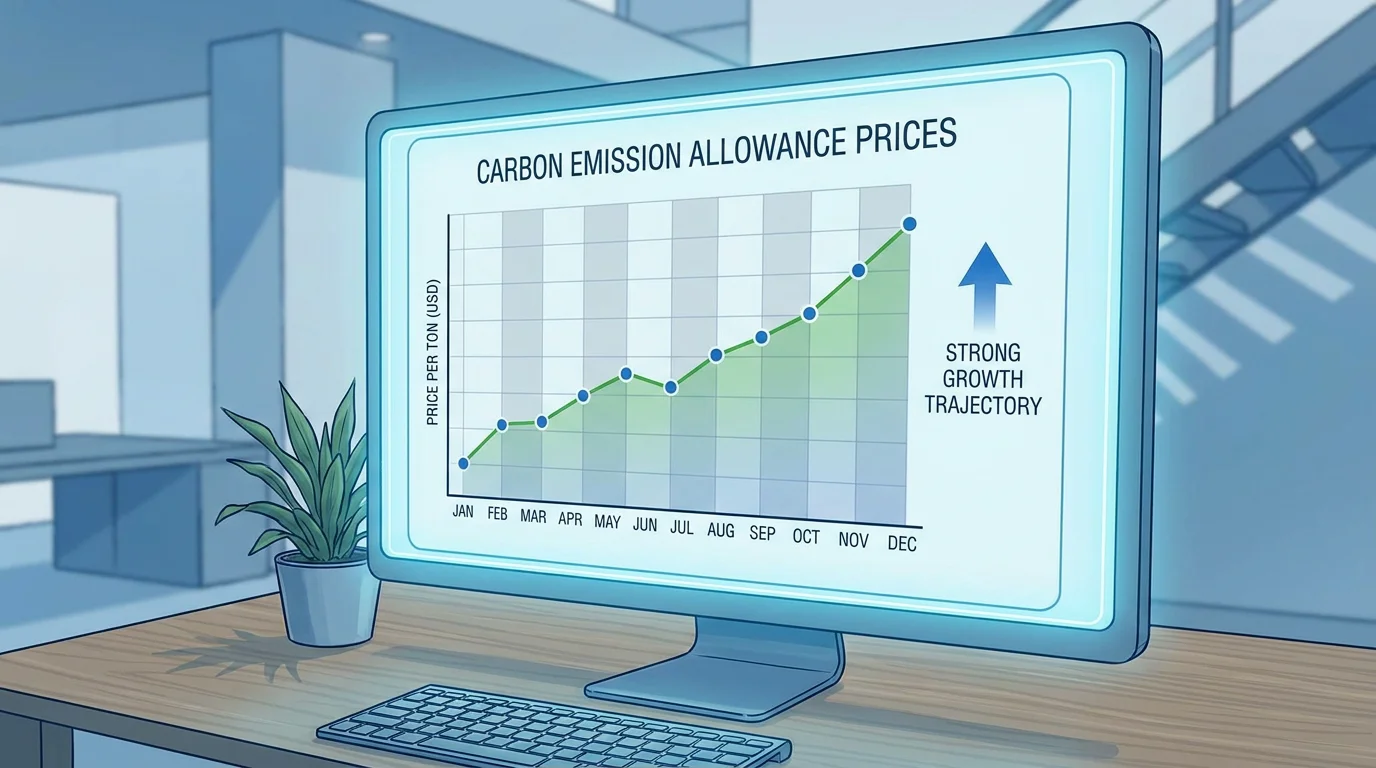
The most powerful price driver is structural: the EU ETS cap shrinks every year. The supply of allowances available in 2026 is approximately 8% lower than in 2025, a massive reduction that mechanically tightens the market. Each annual cut raises the scarcity value of remaining allowances, pushing the EU ETS price upward over time.
Upward price pressure is primarily driven by the gradual phase‑out of free allowances; in 2026, sectors that do not face significant carbon leakage will receive only up to 30% of their carbon allowances for free. By 2030, free allocation for those sectors ends entirely. Understanding these routes to market in carbon emissions trading is essential for anyone exposed to compliance costs.
CBAM Goes Live
2026 is the year the Carbon Border Adjustment Mechanism entered its definitive phase. On April 7, 2026, the European Commission published the first official CBAM price at €75.36 per tonne of CO₂. CBAM extends the carbon price to imports, meaning non‑EU producers now face the same cost signal. This broadens demand for allowances and reduces the incentive for carbon leakage, reinforcing the long‑term price floor.
Speculative and Institutional Flows
According to the Financial Times, hedge funds and speculative investors are increasing their exposure to EU carbon markets amid a looming shortage, with investment funds reaching their highest net long positions since records began in 2018. Institutional conviction adds liquidity but also amplifies short‑term swings, which is why real‑time price monitoring matters more than ever. Knowing how commodity markets influence carbon prices helps explain these cross‑asset dynamics.
Energy Prices and the Fuel‑Switching Dynamic
High gas prices contribute to rising carbon prices: when gas becomes more expensive, power producers switch to coal, which is more carbon‑intensive, increasing emissions and demand for allowances. Conversely, a renewable energy buildout can soften upward pressure. The balance between these forces creates the day‑to‑day volatility that traders must navigate.
Historical Context: From Zero to €105
Context matters when evaluating today's price. Historically, EU Carbon Permits reached an all‑time high of €105.73 in February 2023. Before that peak, the market experienced years of near‑zero pricing during Phase 1, when oversupply crushed the price signal entirely.
The ETS1 carbon price increased to levels well above €50 per tonne since 2021, after the Market Stability Reserve (introduced in 2018) helped rebalance supply and demand, lifting prices from previously low levels. The strengthening of the ETS in line with the 55% emissions reduction target, combined with the energy crisis, pushed average prices to €80 in 2022–2023 before they decreased to €65 in 2024.
In 2025, prices fluctuated between €60 and €80. The takeaway: the EU ETS has matured from a volatile experiment into a deep, policy‑driven market with real financial consequences. Understanding the distinction between voluntary credits vs emissions trading schemes helps clarify why compliance markets command higher, more stable prices.
ETS Price Forecasts Through 2030 and Beyond
Where is the EUA price headed? Analyst consensus points firmly upward, though timelines and magnitudes vary.
| Source | 2026 Forecast | 2027 Forecast | 2030 Forecast |
|---|---|---|---|
| Trading Economics | €76.17 (Q2 end) | €82.31 | N/A |
| GMK Center Consensus | €85 avg | €100 | €126 |
| BBVA | €80–€100 range | N/A | N/A |
| ABN AMRO (Baseline) | N/A | N/A | €145 |
| IETA Survey | ~€100 avg (2026–2030) | ~€100 | |
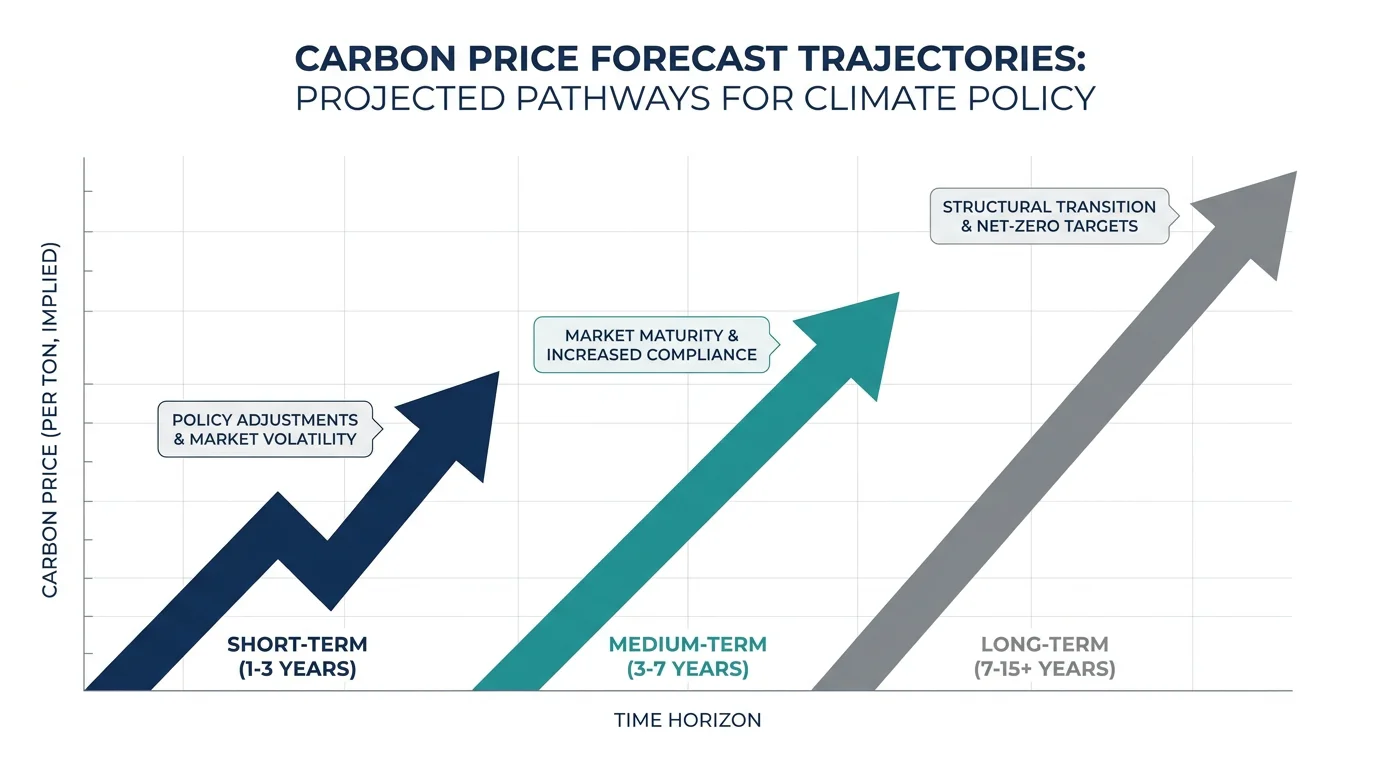
The average CO₂ price is projected to reach €85 per tonne (+18.1% year‑on‑year) in 2026 and cross into triple digits by 2027 at €100 per tonne, according to GMK Center analysis. ABN AMRO's baseline scenario projects prices reaching €145 by 2030 and €200 by 2035, driven mainly by lower supply, as detailed in their EU ETS research.
A survey of International Emissions Trading Association members projects the average EU ETS carbon price to rise to almost €100 per metric tonne of CO₂ during 2026–2030, up from €84.4 during 2022–2025, according to Statista.
Trading Economics models expect the price to reach €76.17 by the end of Q2 2026, with an estimate of €82.31 in 12 months' time. These near‑term forecasts are more conservative, reflecting the current spot environment rather than structural tightening effects that tend to dominate over multi‑year horizons.
Regulatory Milestones That Could Reshape ETS Prices
Several policy events in 2026 and 2027 could significantly shift the supply‑demand balance.
- ETS Directive and MSR Review (2026): The 2026 revision of the ETS Directive and Market Stability Reserve Decision is expected to induce significant changes in ETS design, preparing for a future of allowance scarcity. Possible outcomes include redefined MSR thresholds, new intake rates, and the removal of the invalidation mechanism.
- CBAM Phase‑In Acceleration: ETS1 free allowances for CBAM‑covered sectors will be reduced by 2.5% in 2026 and 5% in 2027. Each percentage point lost in free allocation pushes entities to buy on the open market.
- Maritime Full Coverage: Shipping entered the EU ETS in 2024, and surrender obligations ramp up to 70% of 2025 emissions in 2026, adding a sizable new demand source.
- Aviation Free Allowance Phase‑Out: Free allocation for aviation operators ends as of 2026, removing another buffer that kept demand off the market.
- ETS2 Launch (2027–2028): ETS2 nearly doubles the share of EU greenhouse gas emissions covered by carbon pricing to around 75%. Though it is a separate system, the political signal reinforces the EU's commitment to higher carbon costs.
How Market Participants Access ETS Trading
Historically, EUA trading has been dominated by large compliance entities and banks trading standard lots of 1,000 allowances on exchanges such as ICE and EEX. That structure works well for the largest emitters, but it creates barriers for mid‑market and smaller participants who need flexibility.
There are several access models to consider. Traditional exchanges offer deep liquidity and standardized contracts. Brokers provide voice or screen‑based execution, often bundled with advisory. Direct market access platforms give participants algorithmic connectivity. Evaluating the trade‑offs between a broker vs exchange for ETS trading is a key step in building an efficient procurement strategy.
Our platform addresses the accessibility gap directly. We allow participants to trade from 1 EUA (equivalent to 1 tonne of CO₂) rather than the traditional 1,000 EUA lot. Combined with real‑time price monitoring, pre‑trade risk controls, and API access for automation, our infrastructure is designed for both compliance entities and professional financial participants who want transparent, efficient market access.
Why Real‑Time Price Visibility Matters for ETS Strategies
In a market where a single geopolitical headline can move prices by €7 in a day, delayed data is a liability. Many compliance buyers still rely on end‑of‑day settlement prices or broker quotes, missing intraday opportunities and exposing themselves to execution slippage.
Live price transparency changes the equation. It enables scheduled procurement (buying at pre‑defined price levels), dynamic hedging, and better reporting to boards and regulators. When paired with configurable alerts, participants can automate their response to market movements instead of reacting after the fact.
We built our emissions exchange and ETS price discovery infrastructure around this principle: the price should always be visible, and execution should be one click away, regardless of order size.
What the ETS Price Means for Your Bottom Line
According to the European Commission, the average increase in carbon costs for industry compared to 2025 prices is around €1 per tonne of CO₂ in 2026 and approximately €2 in 2027, as CBAM gradually replaces free allocation. Those numbers may seem small, but they compound across millions of tonnes of annual emissions. For a mid‑sized industrial installation emitting 500,000 tonnes per year, a €10 increase in the allowance price translates to €5 million in additional cost.
Financial participants face a different calculation: the ETS price trajectory represents a multi‑decade investment theme backed by regulation, not just market sentiment. Based on current projections and supply reductions, allowance prices may increase by roughly 7% annually, potentially reaching €400–€500 per tonne of CO₂ by the 2040s, as outlined by Sustainable Ships' forecast analysis.
In both cases, having the right trading infrastructure is not a luxury. It is a cost‑management tool. Our platform supports spot, futures, and options trading, enabling participants to lock in costs, generate yield on held positions, and manage the full procurement workflow in one place.
Conclusion
The ETS trading price sits near €75 today, but the trajectory points higher. Analyst consensus clusters around €85 for full‑year 2026, with triple‑digit prices expected by 2027 and a potential path toward €126 or more by 2030. The forces are structural: a declining cap, the end of free allocation, CBAM enforcement, and expanding sectoral coverage from maritime to aviation. These are not cyclical trends; they are legislated outcomes.
For compliance entities, the implication is clear: delaying procurement is a bet against policy. For financial participants, carbon allowances offer a regulated asset class with a built‑in scarcity mechanism. In both cases, the quality of your market access determines the quality of your outcomes. Our exchange platform gives you transparent pricing, flexible lot sizes from 1 EUA, and the risk controls required for professional carbon trading.
Ready to see how the market moves in real time? Explore our ETS trading solutions for corporates and start building a smarter carbon strategy today.
Frequently Asked Questions
What is the current EU ETS trading price?
As of May 8, 2026, EU Carbon Permits traded at approximately €75.18. Prices have fluctuated between €60 and €92 over the past year, reflecting both policy tightening and geopolitical volatility.
Why are EU ETS carbon prices expected to rise?
The annual reduction of the emissions cap, the phase‑out of free allowances, CBAM enforcement, and expanding sectoral coverage (maritime, aviation) all reduce supply relative to demand. Most analyst forecasts project prices reaching €100 or higher by 2027–2028.
Can smaller companies trade in the EU ETS market?
Traditionally, the 1,000 EUA standard lot size limited access. Our platform allows trading from just 1 EUA, making the market accessible to mid‑market and smaller compliance entities alongside professional financial participants.
This may interest you



Let’s connect
Do you want more information about what we do?