
Summary: A cap-and-trade market prices each tonne of CO₂, pushing polluters to cut emissions. The EU ETS has halved covered emissions since 2005 and raised over €175 billion.
What happens when pollution carries a price tag that climbs every year? In Europe, roughly 40% of greenhouse gas emissions now sit under a system that makes carbon a tradable, scarce commodity. To understand the mechanics behind this market, you may consult our explainer on how carbon markets work. The principle is deceptively simple, yet the consequences reach into electricity bills, industrial strategy and the pace of decarbonisation.
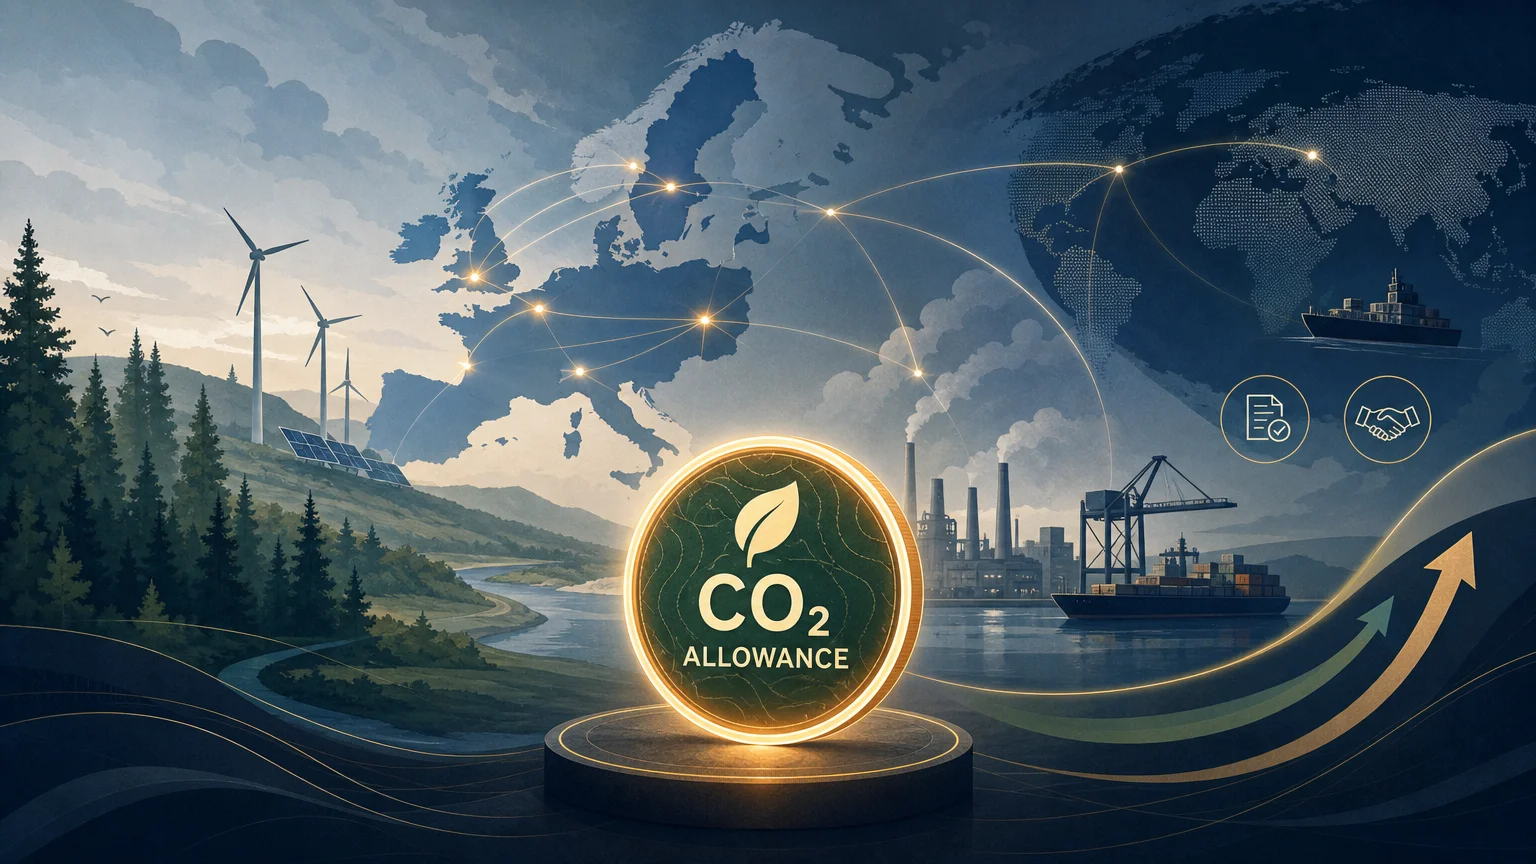
An emissions trading system in support of low-carbon transition works by capping total emissions and letting the market discover a price for the right to emit. As of June 2026, European allowances reached 81.35 euros per tonne, the highest level since February. That price signal is the engine that rewards cleaner production and penalises carbon-intensive output across the continent.
How a cap-and-trade market puts a price on carbon
The mechanism rests on a single rule: a hard ceiling on emissions. The European Commission describes it as a cap that is reduced annually in line with the EU climate target, ensuring that overall emissions fall over time. Each allowance grants the right to emit one tonne of CO₂ equivalent.
Companies must monitor their emissions and surrender enough allowances to cover them each year. If an installation cuts its output of carbon, it can sell surplus allowances or bank them for later. This is the core of a market-based climate policy: scarcity creates value, and value creates an incentive to decarbonise.
The declining supply informs operators about long-term scarcity while keeping allowances liquid and tradable. As the cap tightens, the carbon price signal strengthens, steering capital toward low-carbon electricity, steel and transport. The market, not a regulator, sets the daily price.
The EU ETS: the world's benchmark carbon market
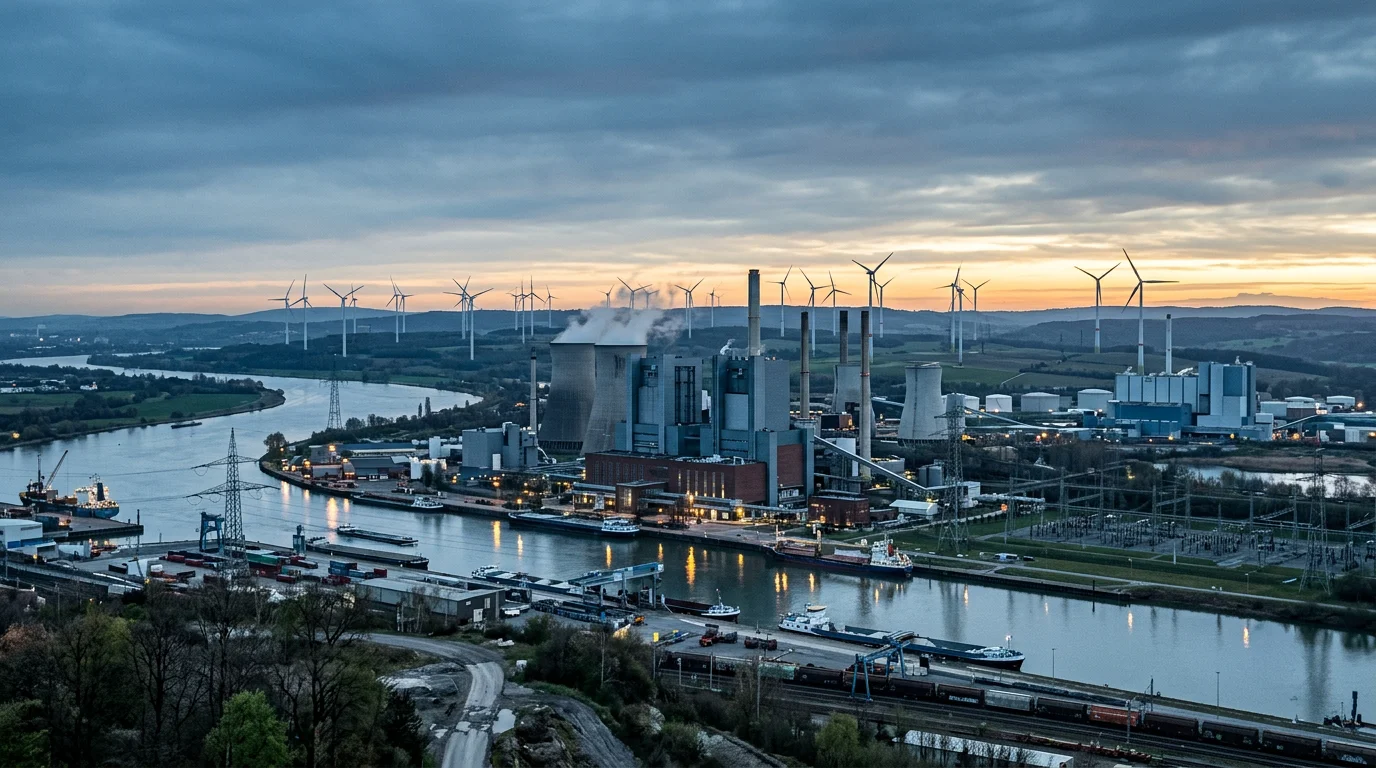
Launched in 2005, the EU Emissions Trading System was the first large-scale carbon market of its kind. It now covers power plants, heavy industry, intra-EU aviation and, since 2024, maritime transport. According to the European Environment Agency, the data reported under the system spans more than 16,000 stationary installations, 1,600 aircraft operators and 2,600 maritime operators.
The scale explains why the EU ETS functions as a global reference for carbon pricing policy. If you want a deeper look at how the European scheme is structured across its four phases, you may read our breakdown of Europe's carbon market. The system is currently in its fourth phase, running from 2021 to 2030.
Free allocation still shields energy-intensive sectors exposed to carbon leakage, yet it is being scaled down and made conditional on decarbonisation efforts. This gradual withdrawal of free allowances is designed to sharpen the price signal precisely where emissions are highest.
Proven results: emissions down, revenues reinvested
Does putting a price on carbon actually reduce emissions? The evidence from two decades suggests it does. The European Commission reported that verified data for 2025 showed a 1.3% reduction in covered emissions compared with 2024, continuing a steady downward trend. Since the system launched in 2005, it has halved emissions in the sectors it covers.
By 2023, the EU ETS had helped bring down emissions from power and industry plants by approximately 47% against 2005 levels, and the tightened cap targets a 62% cut by 2030. These are not marginal gains; they represent structural change in how Europe generates energy and manufactures goods.
The financial dimension matters just as much. Since 2013, the system has raised over 175 billion euros, and Member States are committed to channelling this revenue toward renewable energy, energy efficiency and a just transition. A significant share flows through dedicated instruments; to see how carbon revenues finance clean technology, you may explore our review of the Innovation Fund.
A carbon market does more than cap pollution. It converts the cost of emitting into a stream of public investment for the technologies that make emitting unnecessary.
Expanding the frontier: ETS2, CBAM and wider coverage
The system is not standing still. A second scheme, known as ETS2, has been created to cover emissions from fossil fuels used in buildings, road transport and smaller industrial installations. According to a European Commission analysis, ETS2 nearly doubles the share of EU greenhouse gas emissions covered by carbon pricing, raising it to around 75%.
The timeline remains subject to political negotiation over energy affordability, but the direction is clear: broader coverage and a fuller reach into everyday consumption. To prepare for compliance obligations under this second scheme, you may consult our ETS2 compliance guide.
Alongside expansion, the Carbon Border Adjustment Mechanism (CBAM) is phasing in from 2026. It extends the carbon price to imports of goods such as steel, cement, aluminium and fertilisers, levelling the field between EU and non-EU producers while free allocation is gradually withdrawn. Together, these reforms mark the system's transition toward genuine allowance scarcity.
What carbon pricing means for market participants
For compliance operators and financial participants alike, access to the carbon market has traditionally carried friction. Standard exchanges require large lot sizes, and live pricing is not always transparent. This is where the design of the trading venue becomes decisive.
We built our platform to remove those barriers for industrial operators, banks, trading firms and carbon brokers. The table below sets out how our approach compares with the conventions of traditional exchanges on the criteria that matter most for EU Allowance trading.
| Criterion | Our platform | Traditional exchanges |
|---|---|---|
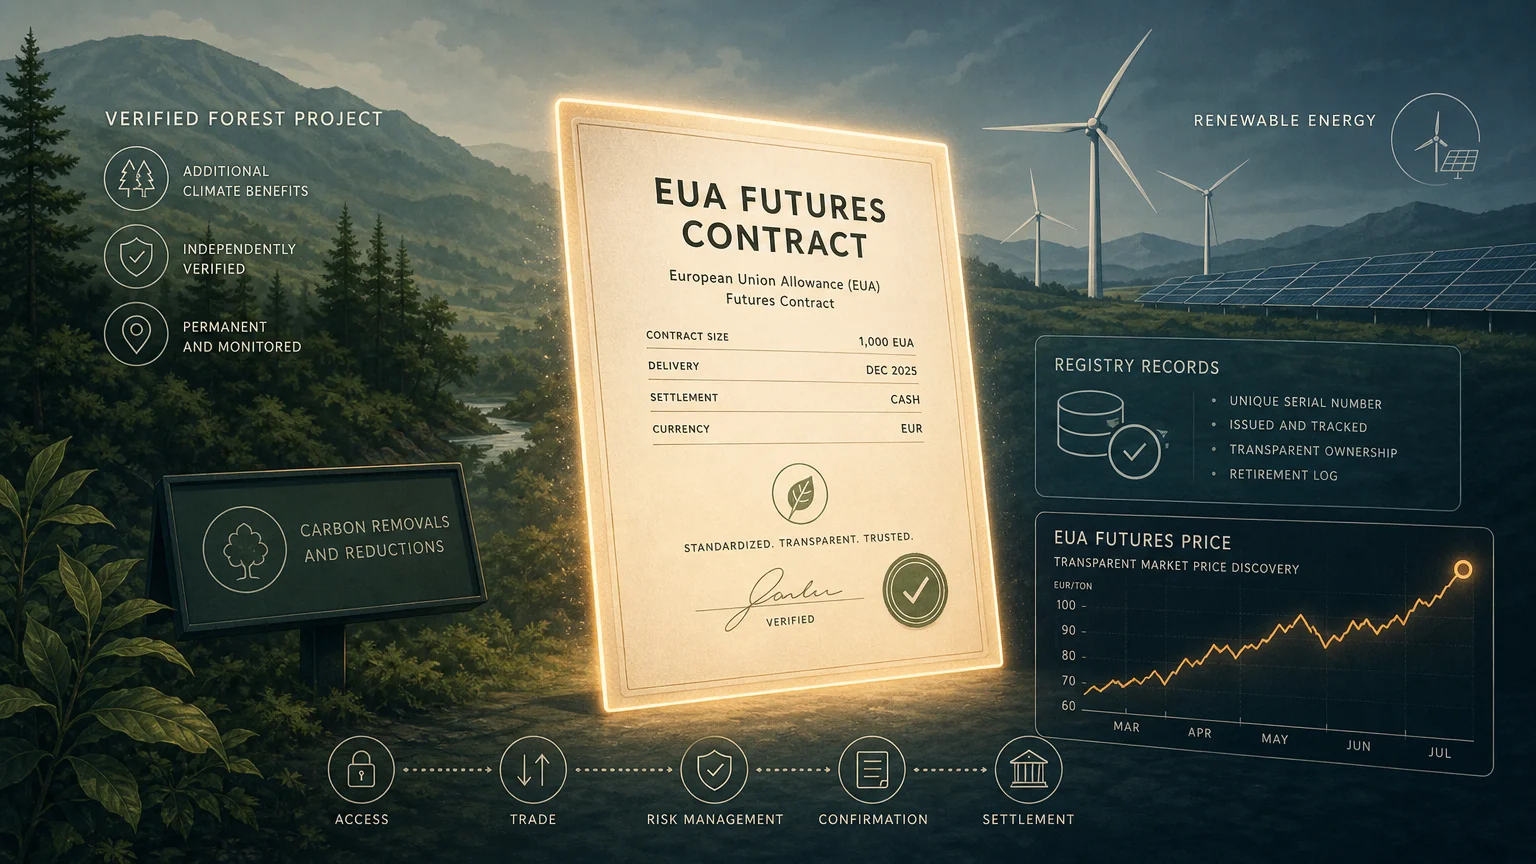
| Minimum trade size | From 1 EUA (1 tonne CO₂) | Standard lot of 1,000 EUAs |
| Pricing | Transparent live pricing | Limited live transparency |
| Automation | API access and configurable alerts | Varies by venue |
| Risk controls | Pre-trade risk controls | Varies by venue |
| Cash protection | Guaranteed up to 100 k€ by the FGDR | Varies by venue |
Smaller trade sizes and real-time monitoring lower the threshold for participation, whether you manage a compliance obligation or a trading strategy. Pre-trade risk controls let you manage exposure before execution, and API access supports integration with existing risk systems.
The direction of travel for carbon markets
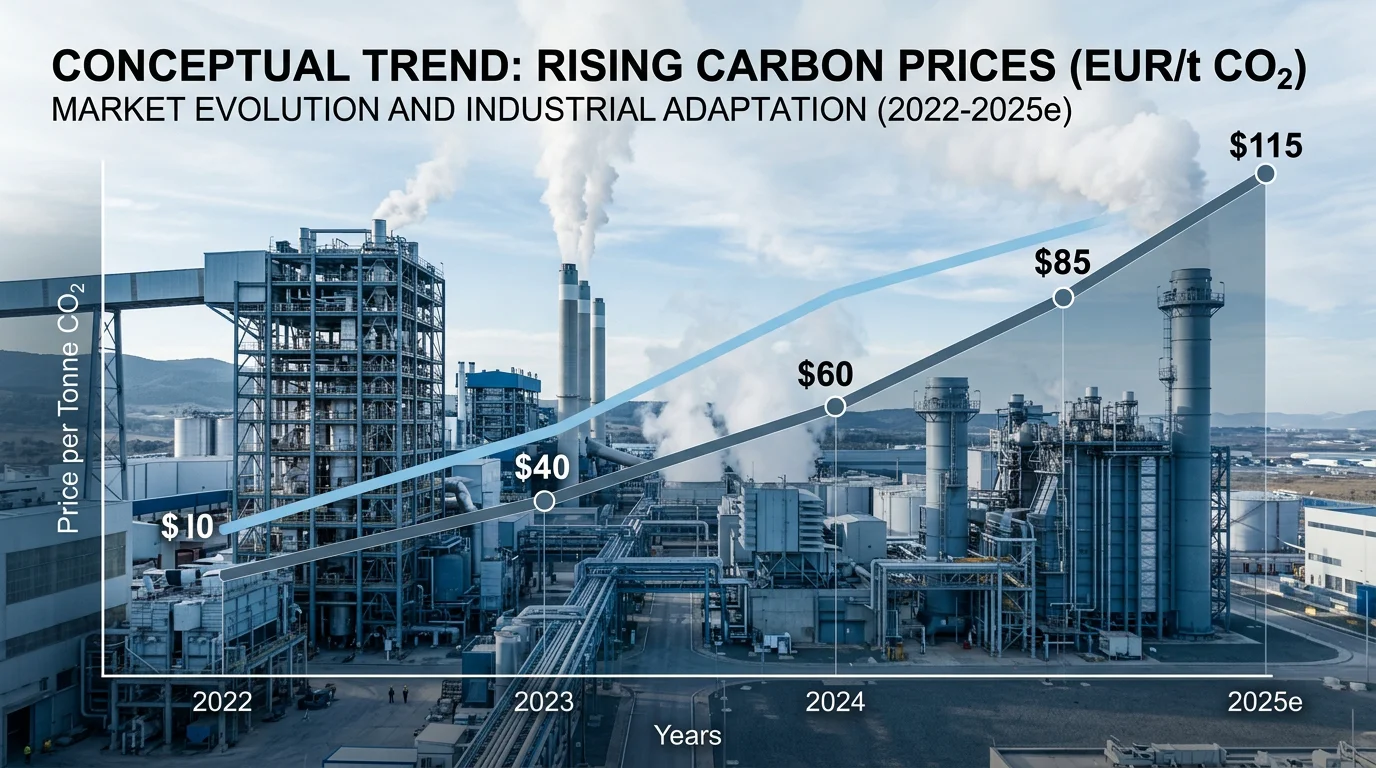
Prices remain volatile. The economy and finance directorate noted that during 2025 allowances fluctuated between roughly 60 and 80 euros, and future markets signal only modest increases through 2027. Volatility is not a flaw; it reflects a market responding to energy prices, weather and policy. Yet the long-term trajectory of a declining cap points in one direction: scarcer allowances and a firmer floor under the carbon price.
For any organisation exposed to these dynamics, understanding the mechanism is no longer optional. The reforms scheduled for 2026 will shape the cost of emitting for a decade to come.
Conclusion
The lesson of two decades is unambiguous: a well-designed emissions trading system supporting the low-carbon transition can halve emissions in its covered sectors while raising over 175 billion euros for climate investment. As ETS2 and CBAM widen the net toward 75% of EU emissions, carbon pricing moves from a sectoral tool to a structural feature of the economy. The practical takeaway is to treat carbon exposure as a core financial variable, not a compliance afterthought, and to build the monitoring and execution capacity to manage it. For that, you gain from a venue offering transparent pricing, small trade sizes and professional-grade risk controls. To take the next step, explore our trading access for traders and corporates.
Frequently Asked Questions
What is the difference between the EU ETS and ETS2?
The EU ETS covers power, industry, aviation and maritime transport. ETS2 is a separate scheme for fossil fuels used in buildings, road transport and smaller installations. Together they are expected to cover around 75% of EU emissions.
How is the carbon price determined?
The price is set by supply and demand in the market, not by a regulator. A declining annual cap reduces the supply of allowances, while auctions and secondary trading establish the daily clearing price.
Can smaller participants trade carbon allowances?
Yes. Traditional exchanges often require lots of 1,000 allowances, which raises the barrier to entry. Our platform allows trading from a single EUA, equivalent to one tonne of CO₂, with transparent live pricing and pre-trade risk controls.