


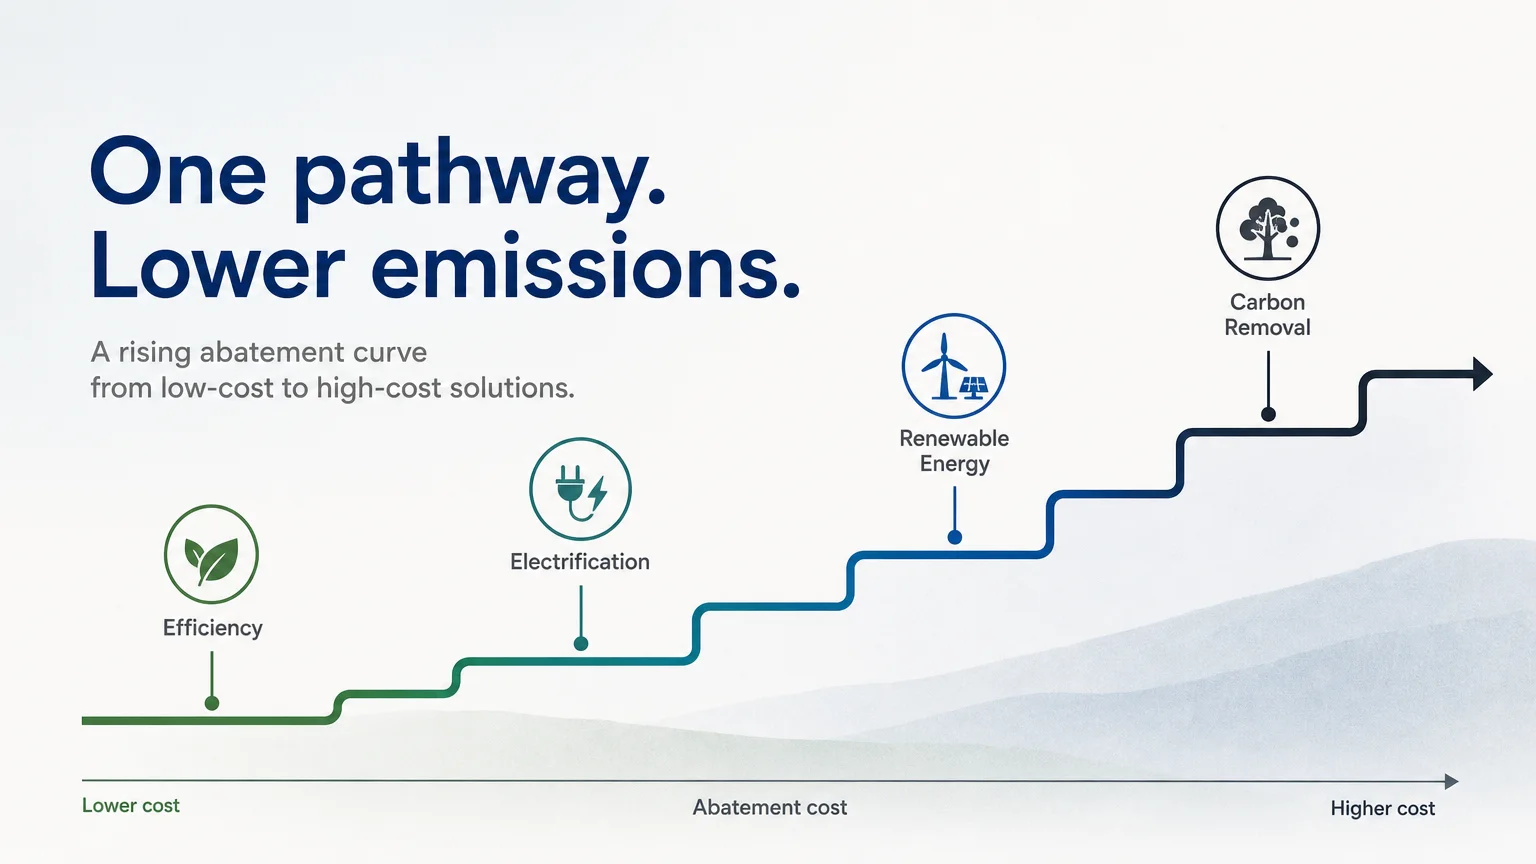

A decision can look inexpensive on paper yet deliver limited progress toward deep decarbonization. That is why understanding an abatement curve matters when you compare emissions cuts, investment needs, and carbon-market exposure. When you need a practical explanation of the underlying calculation, our marginal cost of abatement curve guide provides a useful starting point.
An abatement curve turns separate climate actions into a visual ranking. It shows how much emissions each measure can reduce and what it may cost to avoid one additional tonne. The result can support capital planning, policy design, internal carbon pricing, and decisions about EU Allowances. However, the curve is a decision-support tool, not a complete substitute for sector planning or operational judgment.
What is an abatement curve?
An abatement curve is a chart that compares emissions reduction opportunities according to their cost and potential. The term “abatement” means reducing or avoiding greenhouse gas emissions. The most common version is a marginal abatement cost curve, often abbreviated as MAC curve or MACC.
The horizontal axis usually represents the cumulative emissions reduction available. It may be measured in tonnes of carbon dioxide equivalent, tonnes of carbon dioxide, or another relevant unit. The vertical axis represents the marginal cost of reducing one additional tonne, commonly expressed as dollars or euros per tonne.
Each measure appears as a bar, block, point, or step. Its width represents the possible reduction volume. Its height represents the cost per tonne. Measures below the horizontal axis have a negative cost, which means they may reduce emissions while producing net financial savings. Measures above the axis require additional expenditure.
The exact structure depends on the model. A national curve may cover power, transport, buildings, agriculture, industry, and waste. A company curve may focus on fuel use, production processes, logistics, purchased electricity, or refrigerants. In 2026, the EPA state-level analysis uses disaggregated curves to examine differences in mitigation potential and cost across United States locations.
How do you read an abatement curve?
Suppose you are evaluating five measures for an industrial site. Improving insulation may have a negative cost, electrifying low-temperature heat may have a moderate cost, and replacing a high-temperature process may require a substantial investment. The curve places these options in a sequence based on their modeled marginal costs.
Start with the vertical axis. A value of zero represents an option that is broadly cost-neutral under the model assumptions. A negative value indicates potential savings. A positive value indicates that reducing the next tonne costs money, although the measure may still be necessary for compliance, resilience, or long-term transition goals.
Next, examine the width of each block. A low-cost measure with a narrow block may deliver fewer total reductions than a more expensive measure with a wide block. Therefore, you should assess both dimensions. Looking only at the height can cause you to overlook measures with significant cumulative impact.
Then calculate the cumulative reduction from left to right. The first blocks represent the lowest-cost opportunities in the selected dataset. As you move across the chart, the remaining measures generally become more expensive or technically difficult. This creates the familiar rising shape associated with many MAC curves.
Read the assumptions before interpreting the ranking. Costs may include capital expenditure, operating expenditure, fuel savings, maintenance, financing, and avoided carbon costs. The model may also assume a particular technology lifetime, discount rate, energy price, carbon price, deployment year, or emissions baseline.
What does the curve tell you about carbon pricing?
Carbon pricing creates a direct comparison between paying for emissions and investing in reduction measures. If the carbon price exceeds the modeled marginal cost of a measure, that measure may become financially attractive, assuming the other conditions are suitable.
For a company covered by the EU ETS, this comparison can inform procurement and operational planning. An operator may compare the cost of purchasing EU Allowances with the cost of reducing emissions through fuel switching, process changes, efficiency improvements, or lower-carbon production. The result does not create an automatic trading instruction, but it helps frame the economic decision.
Carbon prices are not the only factor. A measure may have a low modeled cost but face limited supplier capacity, planning barriers, technical risks, or lengthy permitting. Conversely, a high-cost measure may be essential because it addresses emissions that cannot be removed through incremental efficiency improvements.
To connect the economic analysis with live market decisions, our marginal abatement costs guide explains how incremental reduction costs can support carbon-market reasoning. The practical objective is to compare alternatives without treating the model output as a fixed market forecast.
Which measures usually appear on the curve?
What appears on an abatement curve depends on the sector, geography, baseline, and time horizon. A commercial building curve may include insulation, lighting upgrades, controls, heat pumps, and renewable electricity. An industrial curve may include waste-heat recovery, process optimization, fuel substitution, electrification, hydrogen, and carbon capture.
Power-sector curves often include renewable generation, grid efficiency, storage, transmission, demand response, and nuclear-related measures. Transport curves may include vehicle efficiency, modal shift, public transport, battery-electric vehicles, charging infrastructure, and low-carbon fuels.
Land-use and agricultural curves can include avoided deforestation, reforestation, soil management, methane reduction, fertilizer optimization, and manure treatment. These categories should not be compared casually. A reduction from a durable industrial intervention may have different permanence, monitoring, and accounting characteristics than a land-based measure.
The IEA’s chart published in 2026 illustrates how methane measures can be organized by policy type and marginal cost using 2025 data. This shows why the same concept can be applied to a specific gas, industry, policy instrument, or geographic market.
Why is an abatement curve not a complete transition plan?

A curve can rank individual measures accurately while still giving an incomplete picture of the transition. The main reason is interaction. The emissions benefit of an electric vehicle depends partly on the electricity system, while the value of grid flexibility depends partly on how many electric loads are connected.
Timing also matters. Replacing equipment quickly may increase costs because supply chains and skilled labor are constrained. Waiting too long may create a different cost, especially if several sectors must transition simultaneously. A curve based on one target year may not show the operational difficulty of achieving the required deployment rate.
Technology learning creates another limitation. A measure that appears expensive in one year may become cheaper after investment, scale, and infrastructure development. Conversely, rapid demand for a limited resource may increase costs. The curve should therefore be treated as a scenario based on assumptions, not as a permanent ranking.
There is also a difference between the cheapest reduction and the most strategic reduction. Efficiency may be inexpensive, but it cannot eliminate emissions from every process. A harder-to-abate measure may deserve early attention because it requires research, permitting, infrastructure, or workforce development.
These limitations do not make the tool irrelevant. They define how you should use it. A strong analysis combines the curve with technology roadmaps, sector interactions, implementation timelines, regulatory requirements, and sensitivity testing.
What can recent curve analysis reveal?
Recent work shows that an abatement curve can become more useful when it is tailored to a specific source or geography. In January 2026, the EPA described state-level curves as a way to highlight differences in mitigation potential and cost across locations. This matters because infrastructure, fuel availability, industrial activity, and policy conditions vary significantly between regions.
Source-specific analysis can also improve prioritization. For example, a methane curve may identify measures with relatively attractive economics because captured gas has market value. An industrial process curve may show fewer low-cost options, with higher-cost measures carrying greater importance for long-term emissions reduction.
The shape of the curve can indicate diminishing returns. Early measures may be inexpensive and easy to deploy. Later measures may require more complex infrastructure, new fuels, or changes to the production system. A wider gap between early and late costs can signal the need for policy support, innovation, or coordinated investment.
However, you should avoid treating a current curve as a universal statement about every company. A measure can have different economics because of operating hours, asset age, energy contracts, site constraints, financing conditions, and emissions accounting boundaries.
How do you build a defensible abatement curve?
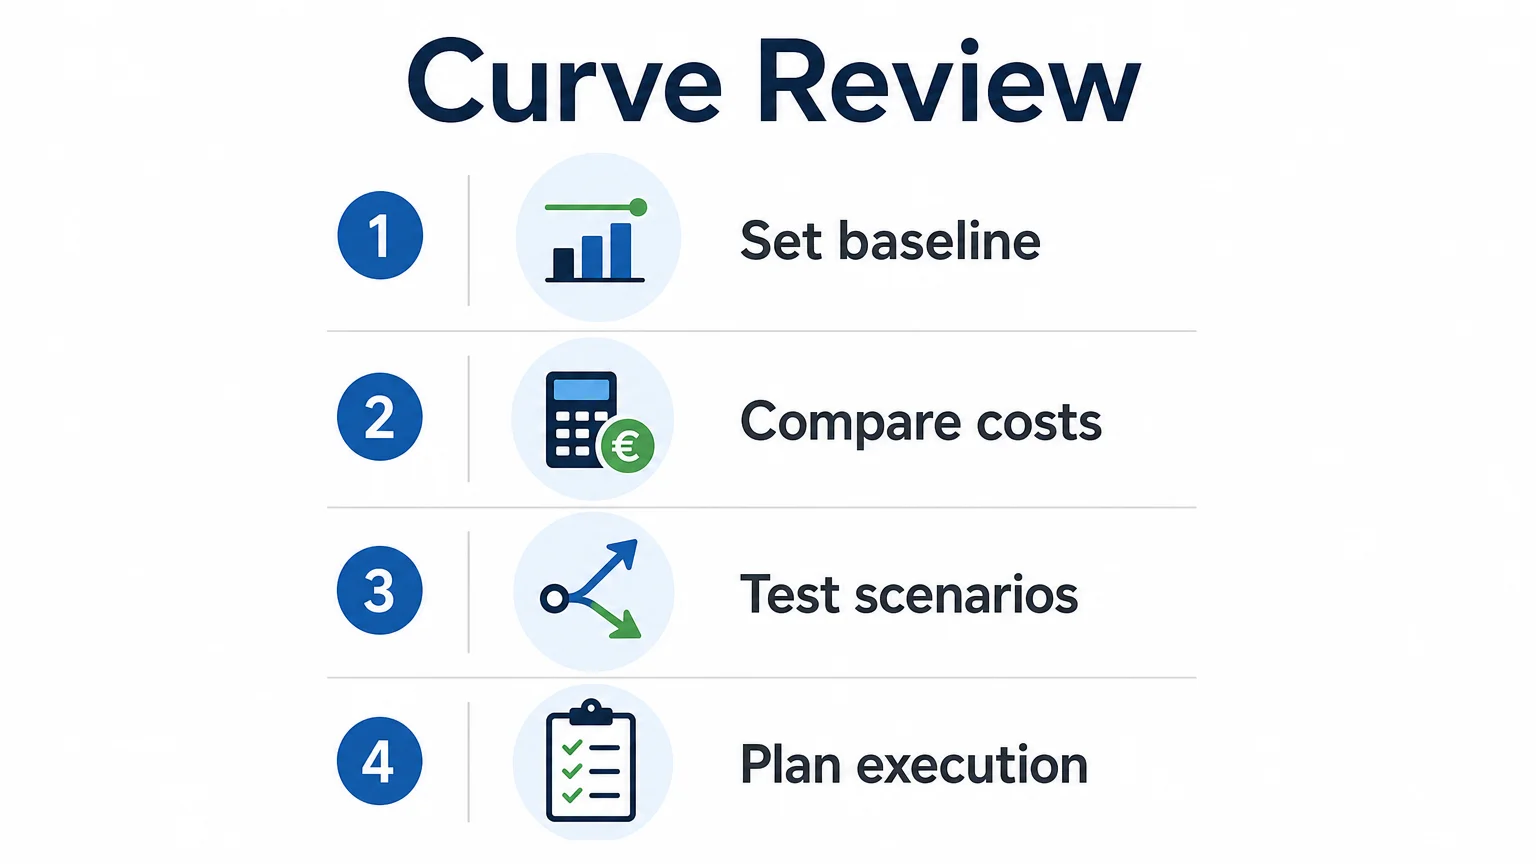
Building a useful curve starts with a clear question. Are you trying to minimize the cost of reaching a fixed emissions target? Compare projects for a capital plan? Estimate exposure to carbon prices? Support an EU ETS procurement strategy? The answer determines the model boundary and the data you need.
Define the baseline carefully. Record current activity, energy use, production volume, emissions sources, operating schedules, and expected asset lifetimes. If the baseline is weak, the resulting reduction potential may be misleading even when the calculations are technically correct.
List measures at a practical level. “Decarbonize production” is too broad for a decision model. More useful measures may include replacing a specific boiler, recovering heat from a defined process, changing a fuel, installing a control system, or modifying a production route.
Estimate both cost and reduction potential. Include upfront investment, operating costs, maintenance, energy savings, avoided allowance purchases, residual emissions, and expected performance. You should also document whether each measure is technically proven, commercially available, or dependent on future development.
Test the main uncertainties. Recalculate the curve using alternative energy prices, carbon prices, discount rates, technology costs, deployment dates, and emissions factors. This reveals which measures remain attractive across scenarios and which depend on a narrow set of assumptions.
Finally, distinguish between model outputs and implementation decisions. The curve can identify priorities, but management still needs to consider safety, production continuity, workforce capability, permitting, financing, and contractual obligations.
How should professional carbon-market teams use the result?
For a trading desk or corporate procurement team, the curve becomes most valuable when it connects strategy with execution. It can help identify whether the organization should prioritize physical reductions, allowance procurement, derivatives hedging, or a combination of these approaches.
The output should be translated into clear operating questions. What volume of emissions remains after planned projects? Which reductions depend on uncertain technology costs? What carbon price would change the investment decision? How much EUA exposure should be managed through spot, futures, or options?
Monitoring is essential because the underlying assumptions change. Energy prices, allowance prices, production levels, regulations, and technology availability can all affect the relative value of a measure. A curve should therefore be refreshed when material inputs change, rather than treated as a one-time report.
In August 2026, an EU-27 analysis from FfE’s 2050 MACC examined how policy instruments relate to decarbonization costs. This type of work reinforces the need to connect cost curves with policy design and sector-specific transition constraints.
For operational teams, our emission abatement resource can help connect reduction concepts with the broader carbon-market context. The goal is not simply to choose the lowest bar. It is to build a robust position that remains workable as markets and projects evolve.
Use the curve as a decision framework
An abatement curve gives you a disciplined way to compare emissions reduction measures by cost and potential. Its greatest value comes from clarifying trade-offs, identifying low-cost opportunities, and showing where deeper reductions require new infrastructure, technology, or policy support. Use it alongside timing, system interactions, uncertainty analysis, and carbon-market exposure. That combination produces a more reliable basis for investment and EU ETS decisions than a cost ranking alone.
Take action with Initiativ
Once your abatement analysis identifies the emissions exposure, the next challenge is managing procurement, execution, and risk in a professional market environment. Your team may need transparent prices, controlled access, reliable reporting, and workflows that connect trading decisions with broader compliance or investment objectives.

We provide carbon trading solutions for traders and corporates, with access to EUA spot and derivatives markets, live price monitoring, configurable alerts, pre-trade risk controls, API connectivity, position management, and confirmation and settlement workflows. Explore how our exchange infrastructure can support your professional carbon-market operations.
Frequently Asked Questions
What is the purpose of an abatement curve?
An abatement curve helps you compare emissions reduction measures by their potential volume and marginal cost. It can support investment planning, policy analysis, internal carbon pricing, and EU ETS decisions.
What does the width of a curve segment show?
The width generally represents the quantity of emissions that a measure could reduce under the model assumptions. A wide segment may indicate significant potential, even when its cost is higher than narrower options.
What does a negative abatement cost mean?
A negative cost means the modeled measure may reduce emissions while generating net financial savings. This can occur when energy savings, avoided fuel purchases, or other benefits exceed the implementation costs.
Can an abatement curve predict carbon prices?
No. It can show how different measures may respond to a carbon price under stated assumptions. Actual prices also depend on market conditions, regulation, supply and demand, expectations, and participant behavior.
How can Initiativ support decisions informed by an abatement curve?
Our platform provides professional access to EUA spot and derivatives trading, live market information, risk controls, API connectivity, and position management. These capabilities can help eligible traders and corporates connect decarbonization analysis with carbon-market execution.
This may interest you



Let’s connect
Do you want more information about what we do?