


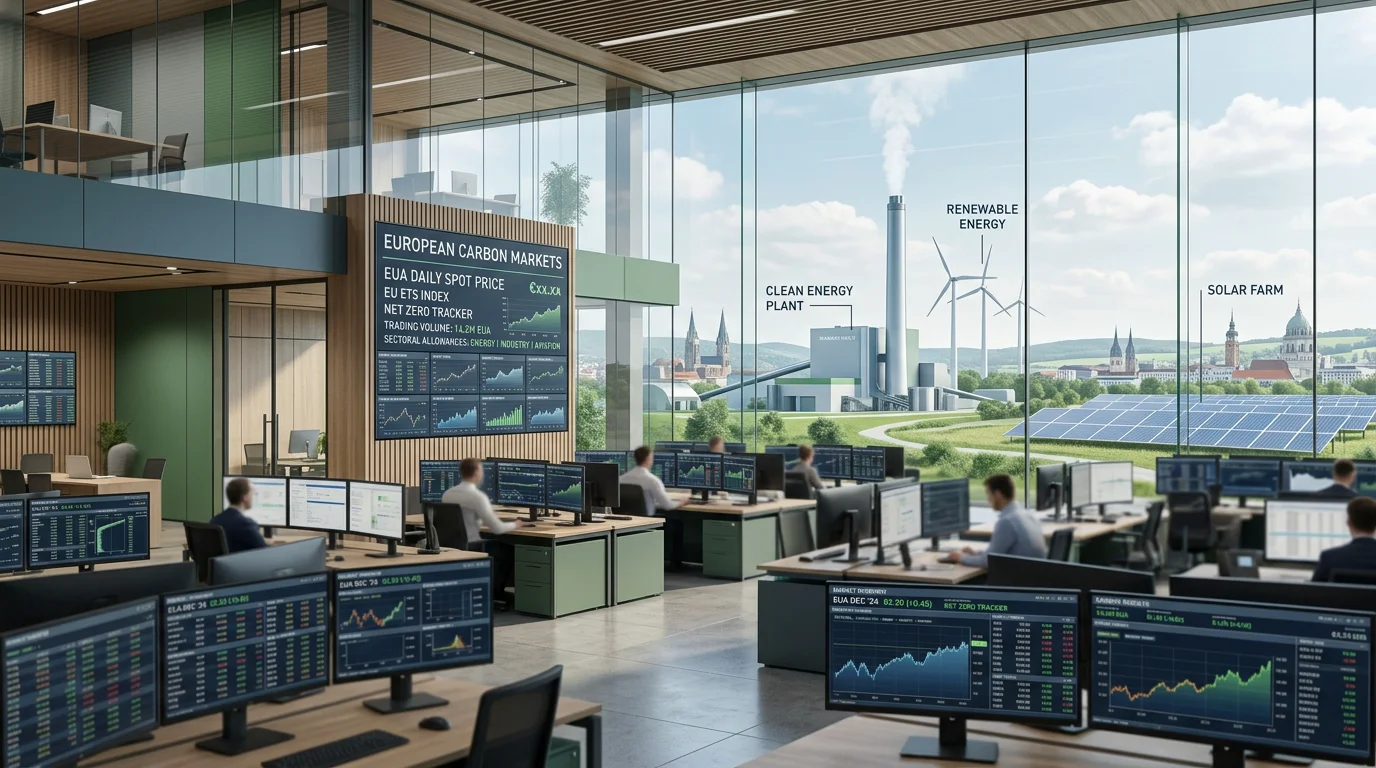

One number now anchors climate finance across an entire continent: the price of a single EU Allowance. It tells industrial operators what emitting a tonne of CO₂ will cost, and it tells investors how ambitious European climate policy has become. Understanding the carbon benchmark and its price signals is therefore no longer a niche skill; it is central to how energy, manufacturing, and finance are managed today. To see how that reference price is formed, you may consult Carbon price discovery in the carbon market.
The stakes are considerable. In 2026, the Carbon Border Adjustment Mechanism entered full enforcement, extending the reach of European carbon pricing to imported goods. According to an EU ETS explainer, the first CBAM certificate price was set at 75.36 euros per tonne, tracking the EU allowance market directly. That single figure now travels far beyond Europe's borders.
What a carbon benchmark actually measures
It is worth clarifying terms first, because the phrase carbon benchmark carries two distinct meanings depending on the industry. In the built environment, it describes an embodied-carbon reference: an average emissions intensity, expressed in kilograms of CO₂ equivalent per square metre, against which a building's design is compared. This meaning dominates sustainability reporting and life-cycle assessment.
In financial and compliance markets, the meaning is different. Here, the reference carbon price is the traded value of an emissions allowance, most often the EU Allowance under the EU ETS. This article focuses on that second meaning, because it drives the daily decisions of traders, industrial operators, and asset managers. The benchmark answers a simple question: what does the market currently charge to emit one tonne of CO₂?
Both definitions share the same logic. A benchmark exists to give raw numbers context, allowing you to judge whether a figure is high or low, improving or deteriorating, against a shared reference point.
How the EU ETS became the reference carbon price
Consider why Europe's system carries such weight. The EU Emissions Trading System was the world's first large-scale carbon market, launched in 2005, and it remains the deepest and most liquid. Under its cap-and-trade design, a fixed number of allowances enters the market each year, and covered installations must surrender one allowance for every tonne they emit.
Because so much volume trades through regulated exchanges, the EUA has become the de facto global carbon price reference. According to Trading Economics data, EU carbon permits are explicitly described as the benchmark market for the commodity, with a recorded all-time high of 105.73 euros per tonne in February 2023. Other jurisdictions increasingly measure their own carbon prices against this European anchor.
To understand how deep trading activity supports that reference, you may review Carbon market liquidity drivers (benchmark support), which explains why order-book depth matters for a reliable price signal.
Where the carbon benchmark stands in 2026
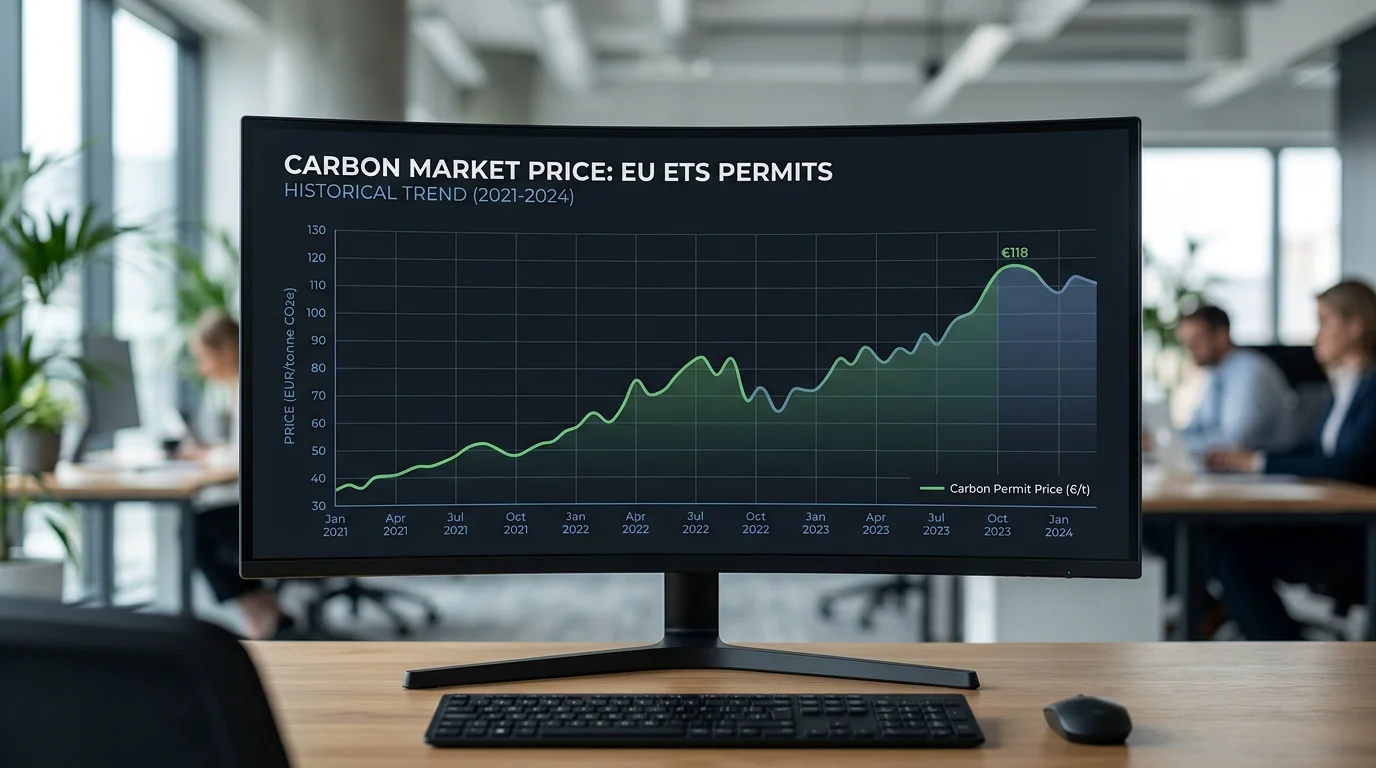
Numbers give the clearest picture of the current market. In May 2026, the December 2026 EUA contract traded between 74 and 77 euros per tonne, and IndexBox market data put the monthly average at 74.04 euros, a 5.7 percent increase compared with March. Earlier in the spring, the allowance had traded around 72 euros in April 2026.
These levels reflect a market shaped by volatile energy prices, geopolitical developments, and anticipation around a scheduled review of the trading system. For a fuller view of the drivers and forecasts behind these movements, you may consult EUA price trends and benchmarks.
The 2026 figures matter because they sit well below the 2023 peak yet remain historically elevated. Forward-looking estimates point higher still: Trading Economics projected the benchmark to trade near 78.65 euros within twelve months. Any figure you cite, however, must be dated, because the reference price changes daily.
What moves the reference price: supply, policy, and liquidity
Why does the benchmark move as it does? Three forces dominate. First, supply is governed by the cap and the Linear Reduction Factor, which steadily shrinks the number of allowances available each year. Second, policy interventions, such as the Market Stability Reserve, absorb surplus allowances or release them when the market is undersupplied.
Third, demand responds to the real economy: electricity generation, industrial output, weather, and fuel switching between gas and coal all shift how many allowances buyers need. In 2026, the launch of full CBAM enforcement added a further demand signal, linking importers of carbon-intensive goods to the same reference price.
Liquidity ties these forces together. A benchmark is only credible when enough participants trade around it to keep the price continuous and transparent. When you monitor these dynamics, our real-time price monitoring and configurable alerts help you translate policy shifts into actionable market intelligence without watching the screen all day.
How to track and act on the reference price
Imagine you are an industrial operator preparing to surrender allowances at year-end, or a trader positioning ahead of a policy announcement. In both cases, you need the same thing: reliable, timely data and a clear execution path. Tracking the benchmark means following spot and futures prices, auction results on regulated exchanges, and the policy calendar together.
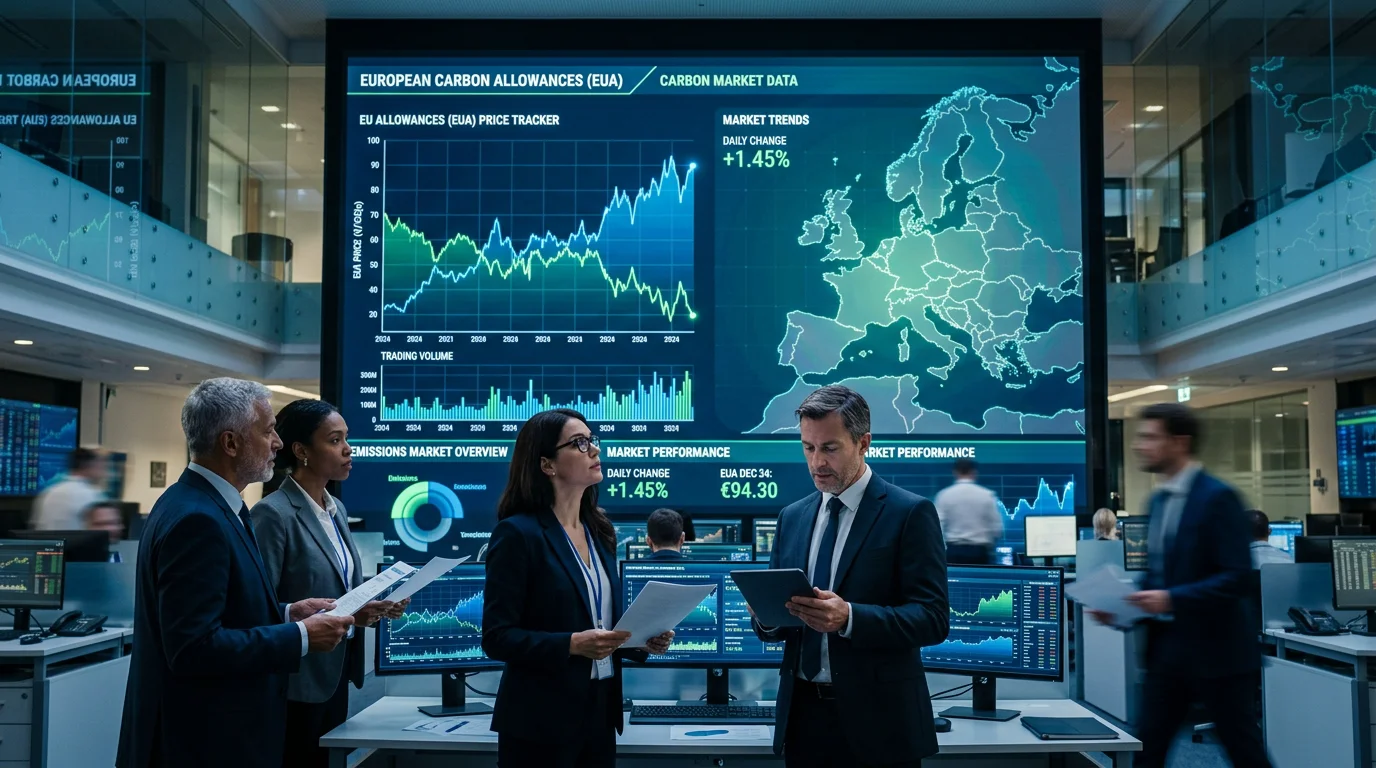
Reliable data is the foundation of every decision. To follow prices, volumes, and trends in one place, you may use Carbon market data for benchmark tracking, which consolidates the metrics that matter for benchmarking. From there, the practical challenge shifts to execution: how quickly and at what minimum size you can act on what the data tells you.
The table below compares common ways professionals engage with the reference price. Our approach is included so you can weigh it against traditional venues on the criteria that affect cost and flexibility.
| Approach | Minimum trade size | Live pricing | Automation |
|---|---|---|---|
| Our exchange platform (Initiativ) | From 1 EUA (1 tonne CO₂) | Transparent live pricing | API access and pre-trade risk controls |
| Traditional regulated exchange | Standard lot of 1,000 EUAs | Available, often via data subscriptions | Varies by member infrastructure |
| Over-the-counter broker | Negotiated, typically large | Indicative, quote-driven | Limited, relationship-based |
Trade sizes on traditional exchanges typically start at a standard lot of 1,000 allowances, which can be a barrier for smaller or more precise positions. We allow trading from a single EUA, equivalent to one tonne of CO₂, so you can align exposure with actual compliance or hedging needs.
Turning the benchmark into decisions
The reference carbon price is more than a headline number; it is a decision-making tool. Read in context, dated correctly, and paired with the policy calendar, it tells you whether costs are rising, whether hedging is prudent, and where European climate ambition is heading. In 2026, with the benchmark near 74 euros and full CBAM enforcement extending its reach, the practical advice is straightforward: track the price continuously, always tag your figures with their date, and connect the signal to a clear execution plan rather than treating it as background noise.
Take action with Initiativ
Following the benchmark is only useful when you can act on it. Whether you manage compliance obligations under the EU ETS or trade allowances professionally, you need faster execution, smaller and more precise trade sizes, and pricing you can trust in real time. That is exactly the gap we set out to close for industrial operators and financial participants alike.
We operate a programmable exchange for EU Allowances in spot and derivatives form, with trading from a single EUA, transparent live pricing, configurable alerts, pre-trade risk controls, and API-enabled automation. Explore our trading platform for traders and corporates and request access to our demo environment to see how it fits your workflow.
Frequently Asked Questions
What is a carbon benchmark in the context of markets?
It is the reference price for emitting one tonne of CO₂ in a given market. In Europe, that reference is the EU Allowance traded under the EU ETS. Professionals use it to judge compliance costs, hedging needs, and investment decisions.
How much does the EU carbon benchmark cost in 2026?
In May 2026, the EU Allowance averaged about 74.04 euros per tonne, having traded roughly between 74 and 77 euros. Prices move daily, so any figure should always be dated. Forward estimates during 2026 pointed toward higher levels within twelve months.
Why is the EU ETS considered the global reference?
The EU ETS launched in 2005 as the first large-scale carbon market and remains the deepest and most liquid. Because so much volume trades through it, other systems increasingly compare their prices to the EU Allowance. That depth makes its price signal credible.
What factors move the reference carbon price?
Supply is set by the emissions cap and the Market Stability Reserve, while demand reflects power generation, industrial output, weather, and fuel switching. Policy events and the 2026 CBAM enforcement also influence it. Liquidity keeps the resulting price continuous and transparent.
How can I trade allowances against the benchmark efficiently?
You can trade through regulated exchanges, brokers, or a specialised platform. On our exchange, you may trade from a single EUA rather than a 1,000-allowance lot, with real-time pricing, alerts, and API access. This lets you align positions closely with your actual exposure.



Let’s connect
Do you want more information about what we do?