




A reliable EU ETS price forecast is not a single number. It is a structured view of how allowance scarcity, energy markets, compliance demand, and policy decisions may affect EUA prices over different time horizons. For a more detailed long-range view, you can compare this analysis with our EU ETS price forecast for 2030.
The most defensible outlook for 2026 is cautious rather than extreme. Official European analysis published in 2025 described EUA prices as having fluctuated between approximately €60 and €80 during 2025, while futures markets implied only modest increases through 2027. Longer-term prices could rise more sharply if the market enters a sustained period of structural scarcity.
What does the EU ETS price forecast indicate for 2026?
The near-term outlook is best described as moderately constructive, but highly dependent on market conditions. The European Commission’s latest available economic analysis, published in November 2025, reported that EU ETS prices had moved within a broad €60 to €80 range during 2025. It also noted that futures markets were signalling only slight price increases through 2027. You can review the underlying European Commission analysis for the assumptions behind that view.
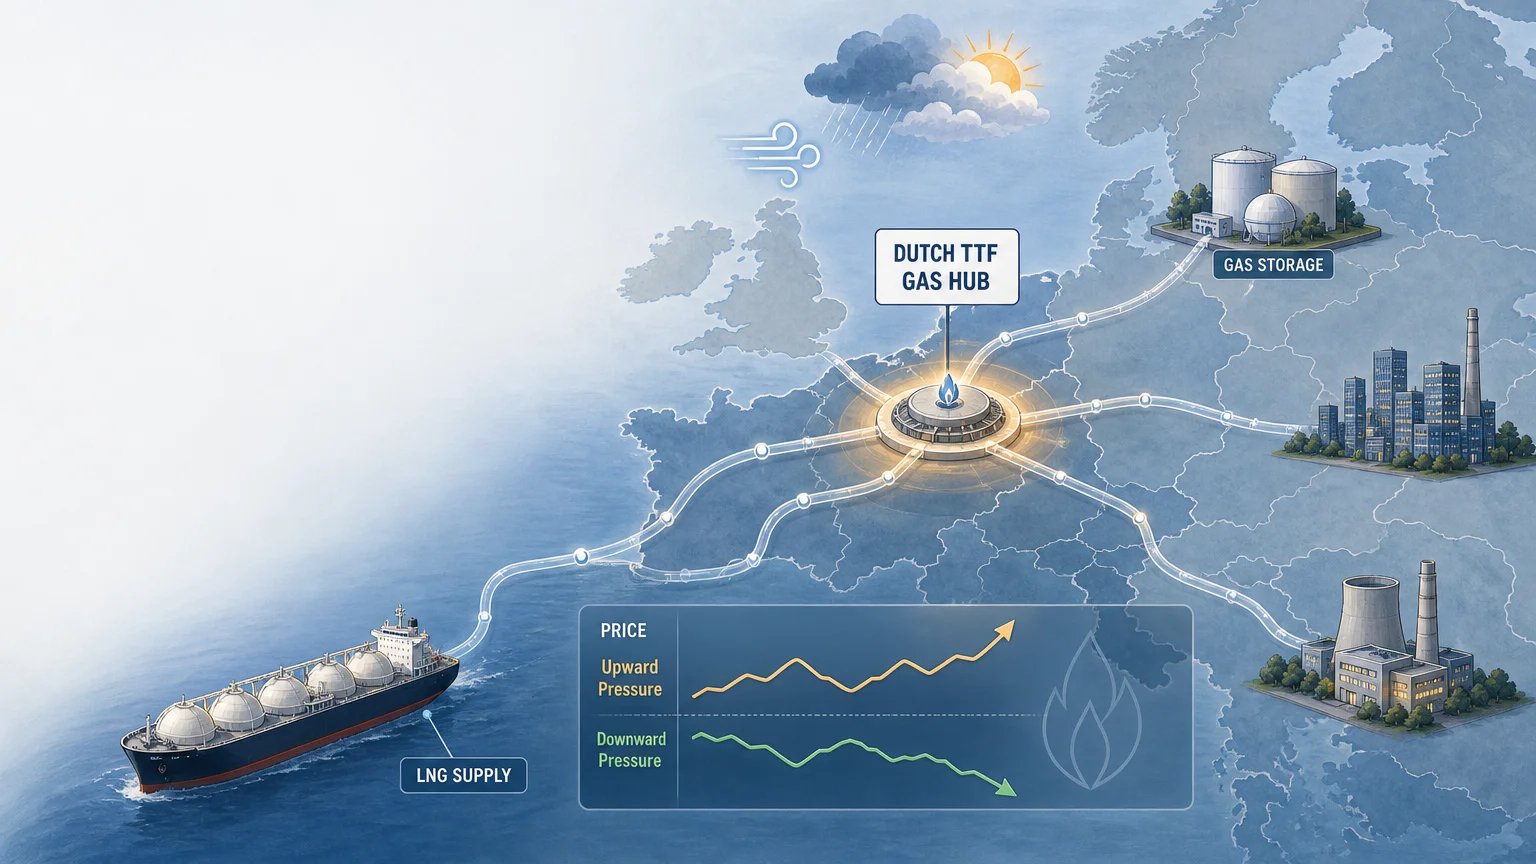
This does not mean that prices will remain stable throughout 2026. EUA prices can react quickly to changes in gas and coal prices, power generation margins, industrial output, weather, auction supply, and expectations about future regulation. A market that appears balanced over several months can become tighter when utilities increase hedging or when industrial participants rebuild compliance inventories.
The distinction between spot and forward prices is also important. Spot prices respond to immediate compliance and trading needs. Futures prices incorporate expectations about future scarcity, hedging demand, interest rates, and policy. A forward curve that rises gradually may indicate tightening expectations, while sudden changes in the curve can reveal new information about energy markets or regulation.
Why can EUA prices rise while emissions decline?

A falling emissions trend does not automatically create lower allowance prices. The EU ETS is designed around a declining cap, so the total number of allowances available can decrease faster than emissions in some periods. If market participants expect future scarcity, they may purchase allowances earlier, increasing demand even while verified emissions are falling.
The latest European Environment Agency and Öko-Institut report shows why supply and demand must be assessed together. Its analysis, published in December 2025, covers historical prices, verified emissions, allowance allocation, projected supply, and the developing ETS2 framework. The report is available through the European emissions trading report.
The Market Stability Reserve is central to this mechanism. It can remove allowances when the market contains a large surplus and release allowances when the circulating quantity becomes low. These adjustments affect the volume available to compliance entities, utilities, traders, and other participants.
Allowance scarcity can therefore become a stronger price driver than current emissions alone. The market may price future supply reductions years before they appear in annual compliance data. This is why a serious forecast should examine the cap trajectory, auction volumes, free allocation, reserve rules, and hedging behaviour together.
Which scenarios should you use for an EU ETS price forecast?
Scenario analysis is more useful than relying on one target. A practical forecast should normally include at least three cases, a lower-price scenario, a central scenario, and a higher-price scenario. Each case should explain the assumptions that could move the market towards that outcome.
Lower-price scenario
A lower-price outcome could develop if economic activity weakens, industrial production declines, renewable generation displaces fossil power, or clean technologies reduce allowance demand faster than expected. Greater liquidity or additional flexibility in market design could also reduce short-term price pressure.
This scenario does not necessarily mean that climate policy is weakening. It may instead reflect faster emissions reductions, lower fossil fuel generation, or more effective abatement investments. Lower demand can reduce EUA prices even when the long-term emissions target remains unchanged.
Central scenario
The central case assumes continued policy implementation, gradual decarbonisation, and moderate economic growth. Under this view, prices may rise progressively as the cap declines, but the path could remain uneven because energy prices, industrial demand, and reserve interventions change over time.
This is often the most useful scenario for budgeting and procurement. It provides a working assumption without pretending that the market follows a straight line. You can update it as auction results, futures curves, emissions data, and regulatory decisions change.
Higher-price scenario
A higher-price scenario could emerge if allowance supply tightens faster than expected, industrial activity remains resilient, or market participants increase forward hedging. A stricter Market Stability Reserve, slower deployment of low-carbon technologies, or delayed infrastructure investment could also increase scarcity.
Regulatory changes can produce temporary price shocks as well as long-term repricing. A reform that reduces available supply may lift prices quickly, while a reform that expands compliance options may moderate the increase. The timing of the change can matter as much as its final design.
For a complementary discussion of these market paths, you can read our EUA price trends and forecasts, which focuses on the relationship between market developments and forward-looking scenarios.
Which market drivers matter most between 2026 and 2030?
Several variables deserve regular attention because they influence both immediate prices and expectations about future scarcity.
- Energy prices: Gas, coal, and electricity prices affect the relative profitability of fossil generation. Changes in switching economics can alter demand for EUAs from the power sector.
- Industrial production: Steel, cement, chemicals, refining, and other covered industries generate compliance demand that varies with output and operating rates.
- Allowance supply: Auction volumes, free allocation, cap adjustments, and reserve interventions determine how many allowances reach the market.
- Policy implementation: The 2026 review of EU ETS rules and the development of related carbon policies may alter market expectations.
- Hedging activity: Utilities and industrial companies may purchase allowances ahead of their immediate compliance needs, creating demand that reflects future exposure.
- Technology deployment: Renewable power, electrification, hydrogen, carbon capture, and efficiency improvements can reduce future allowance demand.
- Market structure: Liquidity, open interest, volatility, and the shape of the futures curve influence execution and risk management.
Recent academic research also suggests that forecasting models can benefit from investment signals related to carbon capture, utilisation, and carbon dioxide removal technologies. A 2026 study found that adding investment-linked information improved forecast accuracy across statistical, machine learning, and deep learning models. The findings are discussed in the 2026 forecasting study.
This does not make any model infallible. It shows that a broader information set can improve analysis when markets are influenced by technology investment, policy expectations, and changing abatement costs. For professional users, this supports a process that combines quantitative forecasts with market intelligence and operational judgement.
To monitor these inputs in one workflow, you can also consult our EU ETS and energy market price drivers, particularly when energy spreads and carbon prices begin moving together.
How should companies use forecasts for procurement and trading?
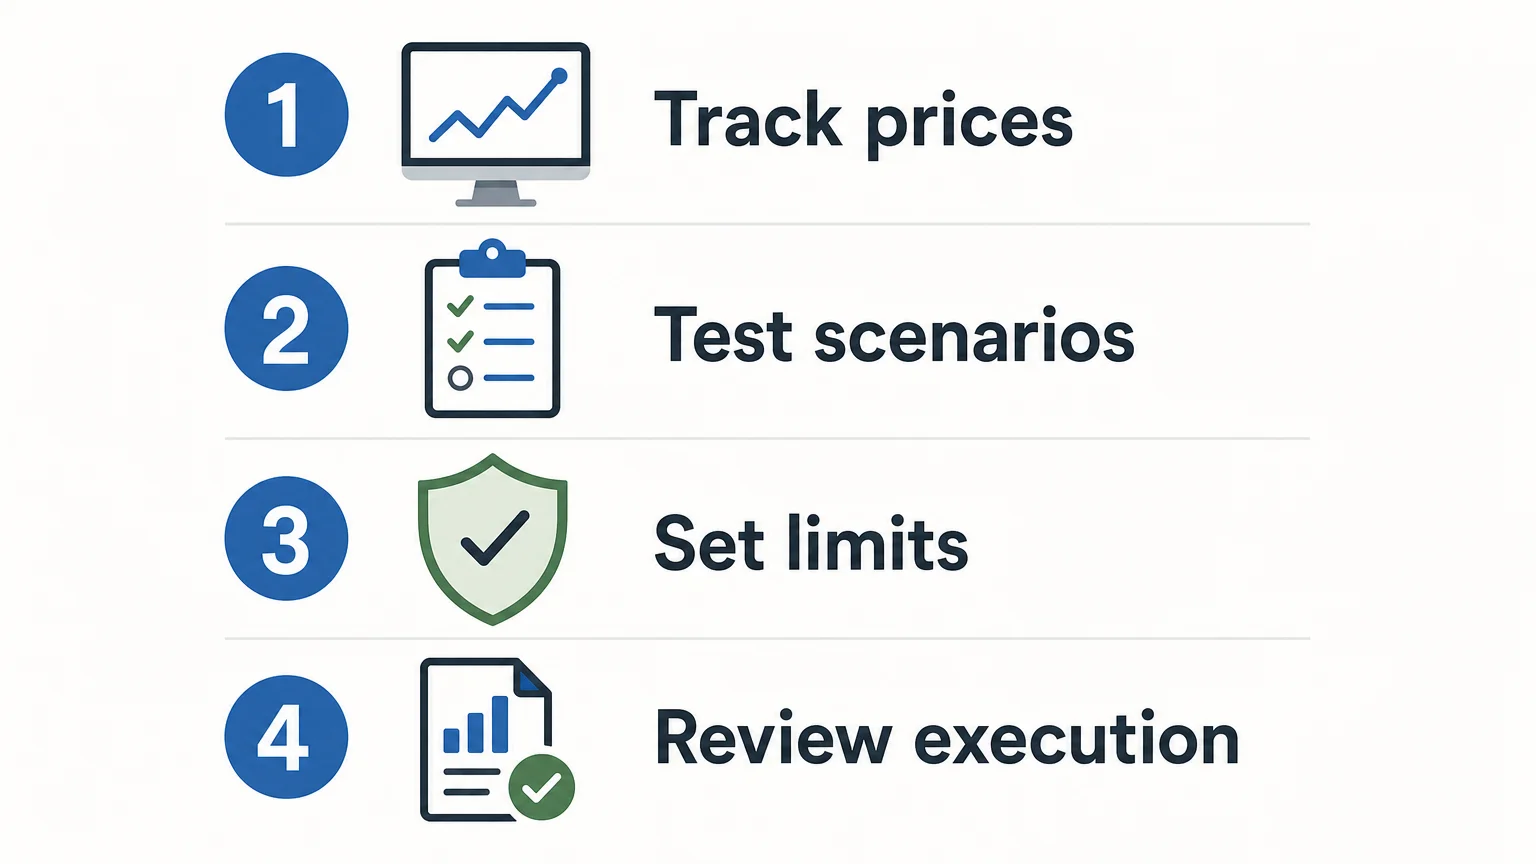
A forecast becomes useful when it changes a decision. Compliance entities can use it to plan purchase timing, define budget ranges, and assess the cost of delaying procurement. Trading firms can use it to structure positions, test risk limits, and compare spot, futures, and options exposure.
The first step is to separate committed demand from discretionary demand. Allowances required for compliance should be managed differently from positions held for hedging or market views. This distinction helps you avoid treating every purchase as a speculative decision.
The second step is to build a procurement schedule. You may divide expected requirements across several dates instead of attempting to identify one perfect entry point. A schedule can reduce timing risk, especially when the forecast range is wide.
The third step is to test adverse scenarios. Consider what would happen if prices rise sharply, if energy prices change the power sector’s allowance demand, or if a regulatory decision alters expected supply. The result should be a budget range, not only a central estimate.
The fourth step is to review execution quality. Price forecasts do not remove liquidity risk, market impact, settlement risk, or operational errors. A professional workflow should connect market data with order controls, position monitoring, reporting, and post-trade processes.
For a practical view of current execution considerations, see our EU ETS trading price and market drivers. The objective is not to predict every movement. It is to make procurement and trading decisions more disciplined when the market changes.
What could change the longer-term forecast?
The 2030 outlook depends heavily on decisions that were still developing in 2026. These include the future design of the Market Stability Reserve, the treatment of carbon removals, the pace of cap reductions, the interaction with CBAM, and possible links with other emissions trading systems.
A 2026 European Commission staff working document indicates that changes to the cap and the Market Stability Reserve are being considered as part of the future design. It states that the preferred approach is expected to support a steadier increase in allowance prices than alternatives with greater variability. You can review the 2026 policy assessment for the broader context.
Carbon removals could also affect the market if they become an eligible compliance option. Their effect would depend on eligibility rules, supply, permanence requirements, verification standards, and cost. A large and credible supply of removals could reduce demand for allowances, while limited availability would have a smaller price effect.
ETS2 should be analysed separately from EU ETS1. ETS2 concerns buildings, road transport, and additional sectors, with fuel suppliers carrying the compliance obligation. Its price path may influence energy costs and policy expectations, but ETS2 allowances are not interchangeable with standard EU Allowances under the existing market structure.
What are the limits of an EU ETS price forecast?
Forecast uncertainty increases with time. A short-term estimate can use observable futures prices, auction calendars, energy spreads, weather expectations, and current compliance demand. A 2030 estimate must also assume how regulation, technology, industrial output, and market design will evolve.
Model disagreement is therefore normal. Two forecasts may use different assumptions about economic growth, hedging horizons, free allocation, abatement costs, or the Market Stability Reserve. A higher price does not automatically mean that one model is better. It may simply reflect a different interpretation of policy or technology risk.
You should also distinguish nominal prices from real prices. A forecast stated in euros per tonne may not use the same inflation assumptions as another forecast. When comparing published estimates, check the price year, currency basis, market definition, time horizon, and whether the estimate refers to spot prices or futures.
The strongest process combines several indicators rather than following a single headline target. Use forecasts to frame decisions, not to replace risk management. That approach is especially important when allowance prices can react to policy announcements before the underlying emissions data changes.
Conclusion: Build a forecast around scenarios
The most useful EU ETS price forecast for 2026 begins with a moderate near-term outlook and then tests how scarcity, energy prices, industrial demand, technology, and regulation could change the path towards 2030. You should avoid presenting one long-range number as certain. Instead, maintain lower, central, and higher scenarios, update them with new market evidence, and connect them to procurement timing, exposure limits, and execution decisions.
Take action with Initiativ
Forecasts are valuable only when your team can turn them into controlled procurement, trading, and risk decisions. That requires timely market information, clear access controls, and workflows that connect execution with positions, reporting, and settlement.
Initiativ supports professional participants with spot and derivatives access for EU Allowances, live price monitoring, configurable alerts, pre-trade risk controls, API connectivity, order-book access, and team-based position management. Explore our EU ETS trading solutions for traders and corporates to assess how the platform could fit your trading or compliance workflow.
Frequently Asked Questions
What is the EU ETS price forecast for 2026?
The 2026 outlook is generally moderate, with prices influenced by allowance scarcity, energy markets, industrial demand, and policy expectations. You should treat any forecast as a range because market conditions can change quickly.
Could EUA prices rise significantly by 2030?
Yes, prices could rise significantly if allowance supply tightens, hedging demand increases, or decarbonisation progresses more slowly than expected. The outcome also depends on the future design of the Market Stability Reserve and related EU climate policies.
What is the difference between EU ETS1 and ETS2?
EU ETS1 covers established sectors such as power generation, industry, aviation, and maritime transport. ETS2 is a separate system covering buildings, road transport, and additional sectors, with fuel suppliers carrying the compliance obligation.
Which factors should you monitor when forecasting EUA prices?
You should monitor energy prices, industrial output, auction supply, reserve data, futures curves, hedging activity, regulatory decisions, and clean technology deployment. These factors influence both immediate demand and expectations about future scarcity.
Can a trading platform help manage EU ETS price risk?
A professional platform can support price monitoring, alerts, pre-trade controls, position management, API connectivity, reporting, and settlement workflows. Initiativ is designed for professional traders, brokers, industrial operators, and corporate teams that need structured access to EUA spot and derivatives markets.



Let’s connect
Do you want more information about what we do?