




Will EUA prices continue rising, or can weaker demand still produce sharp corrections? The most useful answer is conditional rather than absolute. EU Allowances are shaped by policy design, emissions, energy markets, hedging behavior, and market expectations. For terminology and market context, you can consult our ETS trading price analysis.
In 2026, the market is balancing a tightening long-term structure against uncertain industrial activity and pending policy decisions. This makes a single price target less useful than a range of scenarios, clear monitoring indicators, and a procurement or trading plan that reflects your exposure.
What is shaping EUA prices in 2026?
The immediate market question is whether allowance supply is tightening faster than demand is weakening. On May 29, 2026, the European Commission reported a 2025 Total Number of Allowances in Circulation of 1,023,494,202 allowances. It also confirmed that 190,494,202 allowances would move into the Market Stability Reserve between September 1, 2026, and August 31, 2027, according to its 2026 TNAC update.

The MSR does not determine the EUA price mechanically, but it changes how much supply reaches auctions. When allowances are withdrawn, the market has fewer units available for compliance buyers, utilities, and financial participants. That can reinforce bullish expectations, particularly when participants anticipate future scarcity and hedge before the physical shortage becomes visible.
However, a tighter supply profile does not guarantee an uninterrupted rally. If industrial output declines, fuel switching reduces emissions, or companies hold surplus allowances, near-term demand can weaken. The market can therefore remain structurally tight while still experiencing corrections, seasonal movements, and sharp repricing around policy announcements.
For a practical explanation of the benchmark role of EU Allowances, you can refer to our carbon benchmark guide. The central point is that the EUA price is not only a compliance cost. It is also a forward-looking signal about the cost of decarbonisation and the future availability of emissions rights.
What do current EUA forecasts indicate through 2030?
The near-term consensus is positive, although published estimates vary considerably. A survey reported by Euronext in 2026 placed the expected average EUA price at €79.97 per tonne in 2026 and €89.13 in 2027. The same survey included estimates of €100.43 for 2029 and €109.11 for 2030, as reported in its 2026 analyst survey.
These figures describe a moderate upward path. Other model-based scenarios are more aggressive. One ABN AMRO baseline scenario projects €145 per tonne in 2030 and €200 per tonne in 2035, with lower supply and declining TNAC as major drivers. The difference between these projections does not necessarily indicate an error. It reflects different assumptions about emissions, hedging, the linear reduction factor, industrial recovery, abatement costs, and regulatory changes.
Why do forecasts differ so widely?
Forecasts can diverge because the EUA market combines policy rules with commodity-market behavior. A model that assumes stronger economic growth may produce higher industrial emissions and greater allowance demand. A model that assumes faster clean technology adoption may produce lower demand, even while the cap continues to decline.
The time horizon also matters. A short-term forecast focuses on weather, fuel spreads, auction calendars, interest rates, and speculative positioning. A 2030 forecast must also consider cap reductions, free allocation changes, CBAM, sector coverage, and the way companies hedge future compliance needs.
For that reason, you should treat a published target as a scenario output rather than a guaranteed market level. A useful forecast should explain its assumptions, show alternative cases, and identify the variables that would invalidate its central view.
Which factors could push EUA prices higher or lower?
Consider a market where supply declines each year, but demand changes with power generation, industrial output, and policy implementation. That combination creates several distinct price drivers.
Allowance scarcity and the MSR
EU allowance scarcity is the long-term foundation of the market. The cap is designed to decline, while the MSR adjusts auction supply when the system contains too many allowances. The 2026 Commission decision to place more than 190 million allowances into the reserve illustrates how supply management can affect market expectations.
The price response depends on the market balance at the time. If demand is weak, additional withdrawals may have a limited immediate effect. If demand is recovering and participants are already hedging forward requirements, the same supply adjustment can produce a stronger reaction.
Power-sector fuel switching
Power generators compare the economics of coal and natural gas, including fuel costs, efficiency, and the EUA price. When gas becomes relatively more expensive, coal generation can increase emissions and allowance demand. When gas becomes more competitive, generators may reduce their EUA requirements through fuel switching.
This relationship makes energy markets important for short-term EUA analysis. Our EU ETS energy-market guide explains how fuel spreads, generation patterns, and carbon costs interact. Professional participants should monitor these variables alongside auction supply and compliance demand.
Industrial production and compliance demand
Industrial demand can support prices when production recovers in sectors such as steel, cement, chemicals, refining, and other emissions-intensive activities. The opposite is also true. Weak output can reduce immediate demand, particularly if companies have already built inventories or secured forward coverage.
Industrial demand is not limited to the current year. Companies may hedge future exposure several years ahead, especially when allowance scarcity is expected. This forward activity can support prices before verified emissions data confirms a recovery.
CBAM and regulatory reform
CBAM is another important variable because it changes the relationship between imported carbon-intensive products and domestic EU production. Its implementation can affect competitiveness, compliance decisions, and the perceived value of the EU carbon price signal.
The 2026 EU ETS review adds another layer of uncertainty. The European Parliament describes future market performance in terms of price, volatility, and the TNAC to emissions ratio in its 2026 EU ETS briefing. Possible changes to the MSR, cap trajectory, sector coverage, carbon removals, or market safeguards could alter both supply expectations and long-term price scenarios.
Market expectations and positioning
EUAs are influenced by expectations as well as current fundamentals. If traders anticipate tighter supply, stronger climate targets, or increased compliance demand, they may buy earlier. If a reform appears less restrictive than expected, prices can fall even when the long-term cap remains unchanged.
This is why regulatory risk can create price volatility. A market participant may be correct about long-term scarcity but still face losses if the market reprices the timing, scope, or design of future measures.
How should professional participants use EUA forecasts?
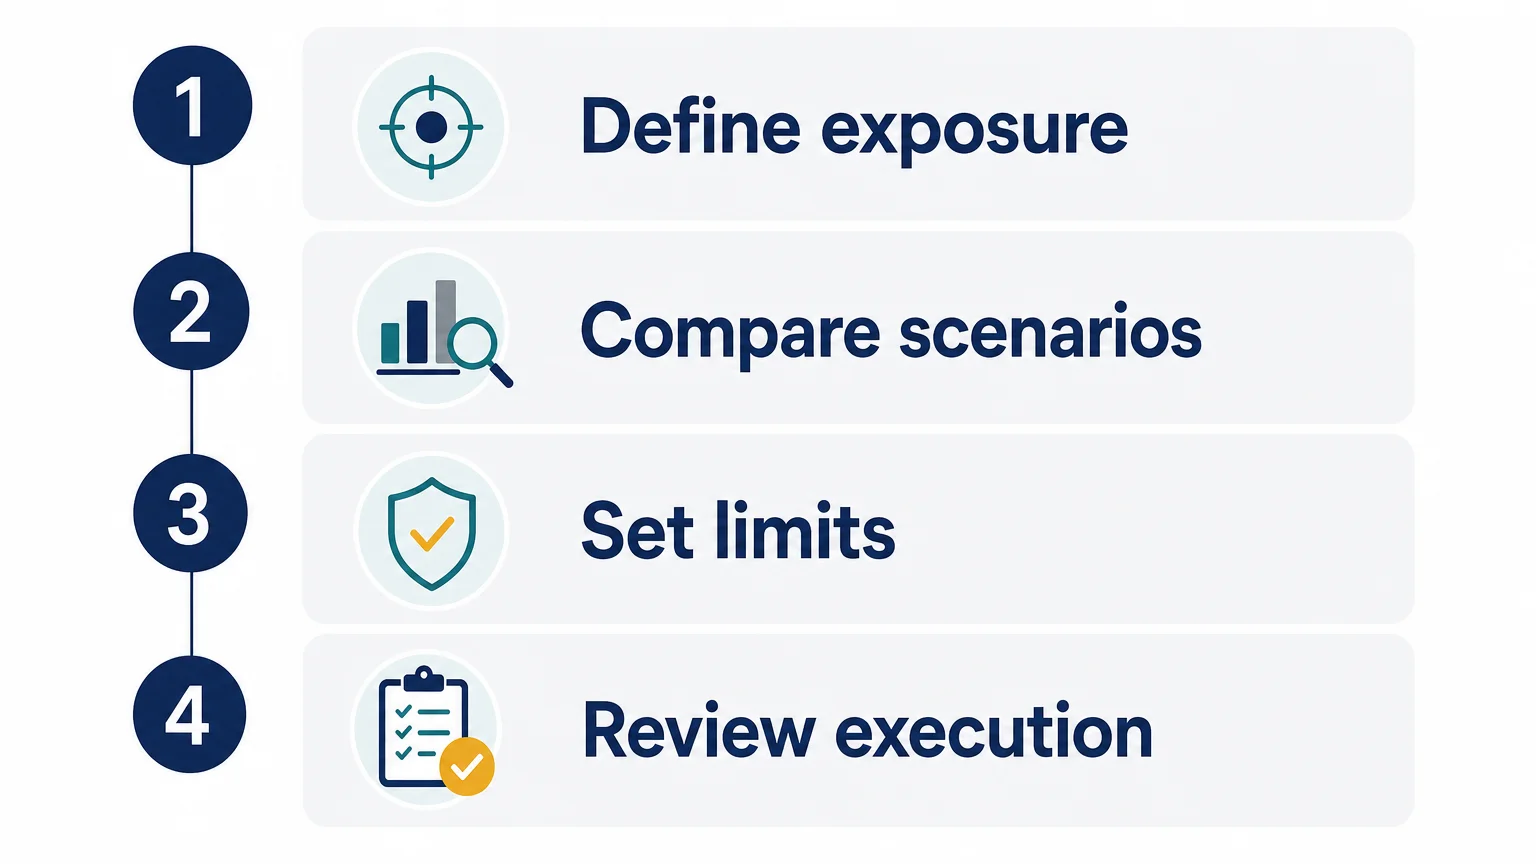
Suppose your organization must purchase allowances for compliance, while also managing cash flow and operational uncertainty. The relevant question is not simply whether prices will rise. It is how much exposure you should cover, over which periods, through which instruments, and under what risk limits.
Separate compliance procurement from directional trading
Compliance procurement usually prioritizes delivery certainty, budget control, and exposure reduction. A trading strategy may instead focus on market opportunities, relative value, or hedging efficiency. These objectives can overlap, but they should not be managed with the same limits or success measures.
A company with a known future surrender obligation may prefer staged purchases rather than one large transaction. A financial participant may require futures, options, or block execution to express a view while controlling margin and downside risk.
Use scenarios instead of one price target
A practical framework can include a central case, a lower-demand case, and a tighter-supply case. Each scenario should specify assumptions about industrial activity, gas and coal prices, clean technology deployment, allowance supply, policy reform, and hedging behavior.
For example, the 2026 analyst survey suggests a more moderate path toward approximately €109 per tonne in 2030. The higher ABN AMRO scenario reaches €145 in that year. These figures can serve as reference points for stress testing, but they should not replace your own exposure analysis.
Our carbon-market data guide provides additional context for monitoring prices and volumes. Reliable analysis should combine market data with your organization’s emissions profile, procurement schedule, liquidity needs, and risk tolerance.
Match the instrument to the exposure
Forward hedging can help address future compliance requirements, while spot purchases may suit immediate delivery needs. Futures can provide standardized exposure, and options can help define downside protection or preserve upside participation. Each instrument introduces different considerations for margin, liquidity, settlement, and basis risk.
Instrument selection should also reflect the certainty of your emissions forecast. If future production is uncertain, purchasing too much too early can create excess exposure. If compliance needs are highly predictable, delaying all purchases can leave your organization vulnerable to a sudden price increase.
Monitor execution and operational risk
Forecast accuracy is only one part of the outcome. Execution quality, order size, market depth, transaction costs, confirmation, settlement, custody, and reporting can materially affect the result.
Professional teams should define who can trade, which instruments are authorized, what limits apply, and how positions are reviewed. API access can support automation, but automated execution still requires testing, controls, monitoring, and clear escalation procedures.
Initiativ is designed for professional participants that need access to EUA spot and derivatives, live prices, configurable alerts, pre-trade controls, API connectivity, position views, and post-trade workflows. Participation requires onboarding, KYC and KYB checks, and qualification as a professional client under MiFID II.
What could challenge the bullish EUA outlook?
A bullish long-term thesis can remain valid while short and medium-term prices disappoint. The principal downside risk is a combination of weaker emissions demand and a policy outcome that adds more flexibility than the market expects.
Lower industrial production would reduce immediate compliance demand. Faster deployment of renewable generation, electrification, energy efficiency, and other abatement measures could also lower emissions. If these changes occur faster than allowance supply tightens, the market may experience periods of surplus or weaker forward demand.
Policy reform could also produce a mixed outcome. A stricter MSR or faster cap reduction would generally support scarcity expectations. The inclusion of carbon removals, additional flexibility mechanisms, or changes to market linkage could reduce demand for EUAs under some scenarios.
Market participants should therefore distinguish between structural direction and timing. A long-term rise does not prevent a temporary decline, and a temporary rally does not prove that the market has entered a permanent scarcity phase.
Liquidity conditions matter as well. Prices can move sharply when auction supply, compliance buying, speculative positioning, and hedging demand converge. This is especially relevant for large transactions, options, and block trades, where execution costs may become more important than the headline price.
What the EUA outlook means for your strategy
The evidence available in 2026 supports a structurally constructive view of EUA prices, but forecasts remain highly conditional. The most reliable approach is to combine EUA price trends and forecasts with allowance-supply data, industrial demand, energy-market signals, regulatory developments, and your own compliance profile.
Use several scenarios, separate procurement from directional trading, and define limits before volatility increases. Whether prices follow a moderate path toward approximately €109 per tonne in 2030 or move closer to higher modelled outcomes, disciplined execution and transparent market data will remain essential.
Take action with Initiativ
Forecasts become more useful when you can connect them to live market information, defined exposure, and an execution process. Professional participants need tools that support monitoring, procurement, risk management, and coordinated trading decisions.
Initiativ provides access to EUA spot and derivatives trading, live prices, configurable alerts, pre-trade risk controls, API connectivity, and position management. For eligible professional participants seeking EUA trading for traders and corporates, the platform also supports team access, reporting, confirmation, settlement, and scheduled procurement workflows.
Frequently Asked Questions
Are EUA prices expected to rise in 2026?
Most published 2026 outlooks point to a positive medium-term direction, supported by declining allowance supply and policy-driven scarcity. However, weaker industrial demand, energy-market changes, and regulatory uncertainty can still produce short-term declines.
What is the main driver of EUA prices through 2030?
The main structural driver is the balance between declining allowance supply and demand from covered sectors. Industrial activity, power-sector fuel switching, hedging behavior, CBAM, and the 2026 EU ETS review can change the timing and strength of price movements.
Why do EUA forecasts differ so much?
Forecasts use different assumptions about emissions, economic growth, clean technology adoption, market design, and future hedging demand. A moderate analyst survey and a higher long-term model can both be internally consistent when their assumptions differ.
Should companies buy EUAs all at once?
That depends on the certainty of your emissions exposure, budget constraints, liquidity, and risk policy. Many organizations compare staged procurement with forward hedging and scenario-based limits rather than relying on a single purchase date.
Can Initiativ support professional EUA trading?
Yes. Initiativ supports professional access to EUA spot and derivatives, including futures and options, with live market data, API connectivity, risk controls, position management, and post-trade workflows.



Let’s connect
Do you want more information about what we do?